CALCULATE YOUR SIP RETURNS

Samvardhana Motherson Slips Below 200-DMA: Breaks Bearish Flag Pattern

29 November 20243 mins read by Angel One
Samvardhana Motherson's shares fall 0.15% to Rs 161.55 on NSE. A bearish flag breakdown and dip below 200-DMA mark a significant technical turn.
Samvardhana Motherson Slips Below 200-DMA: Breaks Bearish Flag Pattern
ShareShare on 1Share on 2Share on 3Share on 4Share on 5

Samvardhana Motherson International Ltd (formerly Motherson Sumi Systems Ltd) is a flagship company of the group, incorporated in 1986 as a joint venture with Samvardhana Motherson International Ltd and SWS. The company is among the world’s largest manufacturers of components for the automotive industry, holding a strong presence globally.

Stock Performance Snapshot

  • November Decline: The stock price of Samvardhana Motherson has fallen by 10.81% this month, closing at Rs 161.55 on NSE, reflecting a decline of 0.15% in the latest session.
  • Year-to-Date (YTD) Performance: Despite the recent drop, the stock boasts an impressive 58.4% gain YTD.

Technical Analysis: Bearish Patterns at Play

The recent technical developments in Samvardhana Motherson’s stock chart:
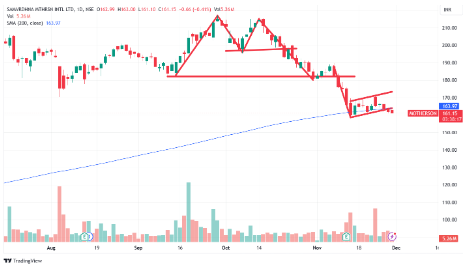
Double Top Formation

  • The stock formed a double top pattern, a bearish reversal pattern, with its neckline at Rs 195.
  • In late October, the stock broke below this neckline, confirming the bearish trend.

Bearish Flag Breakdown

  • Post the double top, the stock entered a bearish flag pattern, a continuation pattern signalling further downside.
  • In November, the stock broke below this pattern, further intensifying the bearish sentiment.

Key Indicator: Dip Below 200-DMA

The stock slipping below its 200-day moving average (DMA) is a critical sign of long-term weakness. The 200-DMA often serves as a support level, and its breach could indicate a change in the trend. 

Understanding the Bigger Picture

While Samvardhana Motherson remains a dominant global player in the automotive sector, the recent technical indicators suggest short-term challenges. It’s important to note that technical patterns reflect market sentiment and should not be the sole factor for decision-making.

Disclaimer: This blog has been written exclusively for educational purposes. The securities mentioned are only examples and not recommendations. It is based on several secondary sources on the internet and is subject to changes. Please consult an expert before making related decisions.

We're Live on WhatsApp! Join our channel for market insights & updates

Open Free Demat Account!

Join our 2 Cr+ happy customers

+91
Enjoy Zero Brokerage on Equity Delivery
4.4 Cr+DOWNLOADS
Enjoy ₹0 Account Opening Charges

Get the link to download the App

Send App Link
Get it on Google PlayDownload on the App Store
Open Free Demat Account!
Join our 2 Cr+ happy customers