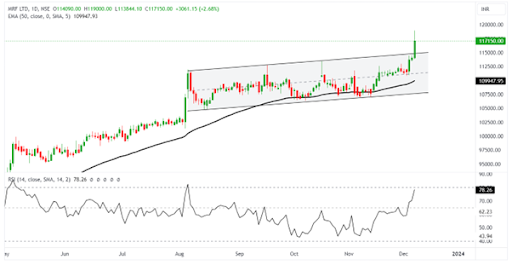
MRF Ltd is a breakout candidate for today and may lead to record new milestones in the coming time. The stock price is currently trading at Rs 1,17,093 and has witnessed the formation of a rising channel chart pattern. The RSI, ADX, and other parameters of technical analysis are in sync with the breakout.
In technical analysis, a rising channel, also known as an ascending channel, is a chart pattern that suggests an uptrend in the price of an asset. It is formed by two parallel upward-sloping trendlines, with the price action bouncing between them.
The rising channel indicates an ongoing uptrend, where the price consistently makes higher highs and higher lows. The channel is formed by two trendlines drawn parallel to each other. The lower trendline connects the consecutive swing lows (higher lows), while the upper trendline connects the consecutive swing highs (higher highs). The price action typically bounces between the two trendlines, demonstrating support on the lower line and resistance on the upper line. Rising channels can last for varying lengths of time, ranging from days to months or even years.

1-day chart of MRF Ltd
MRF’s stock traded with a strong bullish breakout candle, touching an all-time high as the day progressed to break the chart pattern called an ascending channel.
The stock witnessed a flat opening at Rs 1,14,090, jumped to its day high of Rs 1,19,000, and touched an intraday low of Rs 1,13,844. The stock has been in a rising channel for the last 4 months.
MRF has formed an ascending channel chart pattern, which is a sign of a continuation of the uptrend for the stock price. The stock price may consolidate for some trading sessions to achieve new highs and accumulate some volume. The breakout seems strong, but sellers are putting some pressure on it, as reflected by the upper shadow of the day candle. Once the profit booking of short-term traders is complete, the stock will trade at its new all-time high with high momentum.
The relative strength index also entered the 65–80 range without any whipsaws and was about to touch the bought region, suggesting bullish momentum for stocks. The ADX indicator line is also at 34, showing the good strength of the price.
During any corrective moves, the major support level to watch for is Rs 1,15,100. The overall structure remains favourable for traders, as the stock continues to trade above all its important moving averages, indicating a sustained upward trend.
The stock has given substantial returns of 6,056.52% over a decade.
MRF Ltd engages in the manufacture, distribution, and sale of rubber products.
Disclaimer: This blog has been written exclusively for educational purposes. The securities mentioned are only examples and not recommendations. The information is based on various secondary sources on the internet and is subject to change. Please consult with a financial expert before making investment decisions.
Published on: Dec 7, 2023, 4:50 PM IST
We're Live on WhatsApp! Join our channel for market insights & updates
