
Sobha Limited Ltd is a strong breakout candidate for today. The stock price is currently trading at Rs 968 and has witnessed a very clean break-out of the flag and pole chart pattern. The RSI and other parameters of technical analysis are in sync with the breakout.
Flag and pole chart pattern is a continuation pattern that indicates a pause or consolidation in a strong trend before the trend resumes in the same direction. The pattern is composed of two parts:
Flagpole: This is a sharp move in one direction, followed by a period of consolidation. The flagpole should be at least 3-5 candles long and should have a vertical angle of at least 45 degrees.
Flag: This is a trading range that forms after the flagpole. The flag should be smaller than the flagpole and should be contained within parallel trendlines. The trendlines should be drawn connecting the highs and lows of the flag.
Bullish flag: This pattern forms after a strong uptrend. The flagpole should be up, and the flag should be contained within a rising channel. A breakout above the upper trendline of the flag indicates that the uptrend is likely to resume.
Sobha Ltd
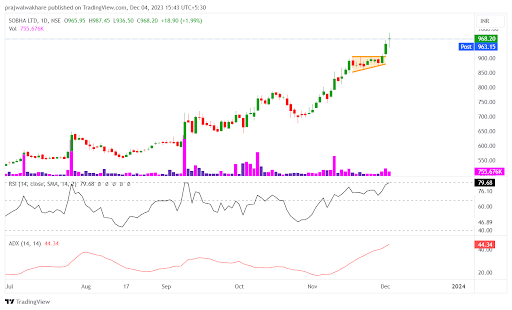
1-day chart of Sobha Ltd
Sobha Limited’s stock closed with an indecision candle as the day progressed to hit a multi-year high of Rs 987.45 with market trading at an all-time high.
The stock witnessed a gap-up opening at Rs 965, jumped to its multi-year high of Rs 987, and touched an intraday low of Rs 936. The stock is in a strong uptrend daily.
Sobha has seen a flag and pole chart pattern breakout as well as a near-time high breakout, which is a positive sign. The stock price broke its upper resistance of Rs 900 and traded high with sustenance; the volume was more than the daily average. The volume chart also frames a feasible pattern for a breakout as it decreases over time and gradually increases as a breakout nears.
The relative strength index also entered the 65–80 range, suggesting bullish momentum for stocks. The ADX indicator line is also at 44, showing the strength of the price trend.
During any corrective moves, the major support level to watch for is Rs 900. The overall structure remains favourable for traders, as the stock continues to trade above all its important moving averages, indicating a sustained upward trend.
The stock has given substantial returns of 66.68% over 6 months.
Sobha Ltd engages in the construction, development, and management of real estate. It operates through the real estate, contractual, and manufacturing segments.
Disclaimer: This blog has been written exclusively for educational purposes. The securities mentioned are only examples and not recommendations. The information is based on various secondary sources on the internet and is subject to change. Please consult with a financial expert before making investment decisions.
Published on: Dec 4, 2023, 5:37 PM IST
We're Live on WhatsApp! Join our channel for market insights & updates

Get the link to download the App

