
Hindustan Aeronautics Ltd (HAL), a ‘Navratna’ company, was incorporated in 1964 through the amalgamation of Hindustan Aircraft Limited and Aeronautics India Limited. HAL is a key player in India’s defense sector, engaged in the design, development, manufacture, repair, and overhaul of aircraft, helicopters, engines, and related systems such as avionics, instruments, and accessories. Additionally, HAL manufactures structural parts for various satellite launch vehicles for the Indian Space Research Organization (ISRO).
On Thursday, HAL’s share price increased by 1.5% during the trading session. The stock opened at Rs 5,475, hit an intraday low of Rs 5,459.30, and is currently trading near the day’s high. This upward movement has been technically significant due to a neckline breakout of the double bottom pattern.
The double bottom pattern is a bullish reversal pattern that signals a potential upward trend after a downtrend. It consists of two distinct lows forming near a common support level. The area between these two lows, known as the neckline, is crucial. A breakout above this neckline typically indicates a reversal to an uptrend.
HAL’s stock rose by 42% from the lows of June 05 to its 52-week high of Rs 5,582.80. After reaching this peak, the stock experienced a pullback, registering a swing low of Rs 5,114.60. Following this, the stock attempted to rise again but was halted at Rs 5,455, before dropping to find support at Rs 5,213. This series of movements resulted in the formation of a double bottom pattern, with the neckline positioned at Rs 5,455. Though it might not be a textbook-perfect double bottom, the pattern’s essence remains intact.
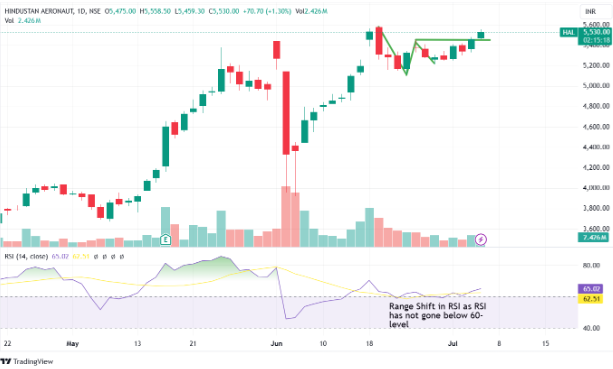
Recently, HAL’s stock broke through the neckline of this double bottom-like pattern, indicating a bullish reversal. The 14-period daily RSI (Relative Strength Index) has shifted towards the super bullish zone and is trending higher, which is a positive indicator for the stock.
In 2024, HAL’s stock jumped about 98%, reflecting strong bullish sentiment. The recent technical observations, including the double bottom pattern breakout and the rising RSI, suggest that HAL is well-positioned for further gains. Given these indicators, investors should keep HAL on their watch list for potential opportunities.
Hindustan Aeronautics Ltd (HAL) continues to demonstrate its strength, not only through its substantial role in India’s defense and space sectors but also through its robust stock performance. The recent technical breakout indicates potential for further growth, making HAL a stock worth watching for both existing and potential investors.
Published on: Jul 4, 2024, 3:46 PM IST
We're Live on WhatsApp! Join our channel for market insights & updates

Get the link to download the App

