
On Monday, the Indian equity benchmark indices saw some profit booking, with the BSE benchmark Sensex and NSE benchmark Nifty trading down by 0.15% and 0.14%, respectively. Despite the slight downturn, certain sectors displayed strong performance, notably the Nifty Oil & Gas index.
Among the top-performing sectoral indices on Monday was Nifty Oil & Gas, which traded higher by 0.53%. A key player in this sector is the Oil & Natural Gas Corporation Ltd (ONGC), the heavyweight of the Oil & Gas index, with a weightage of 15.31%. ONGC shares rose by 2.69% on Monday, hitting a fresh 52-week high of Rs 296.30 on the NSE.
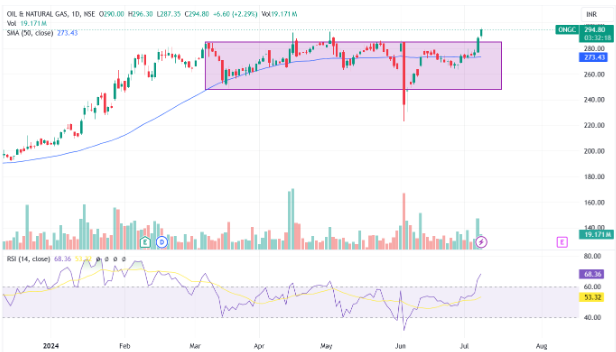
Consolidation Breakout
Technically, ONGC has shown significant strength. The stock broke out of an 81-day consolidation phase with strong volume. It also broke out of an inverted head and shoulders-like pattern, which, although not a textbook example, confirmed the breakout with massive volume.
Moving Averages and Indicators
ONGC is trading near its 52-week high, having cleared all resistance levels and trading above all key moving averages. It is currently 5.50% above the 50-day moving average (50DMA). The Bollinger Bands’ contraction indicates a probable impulse move, suggesting potential for further gains.
Momentum Indicators
The MACD is above the zero line, with the histogram indicating bullish momentum. The RSI has shifted into a strong bullish zone. Additionally, the Elder Impulse System has formed a solid bullish bar, reinforcing the positive outlook. Both the KST and the Stochastic RSI are in bullish setups, further supporting the bullish breakout.
In 2024, ONGC has gained as much as 43.65%, and over the past year, the stock has risen by an impressive 80.34%. This performance underscores the stock’s robust growth trajectory and technical strength.
ONGC’s recent breakout and strong technical indicators suggest continued bullish momentum. Investors should keep an eye on this stock.
Disclaimer: This blog has been written exclusively for educational purposes. The securities mentioned are only examples and not recommendations. The information is based on various secondary sources on the internet and is subject to change. Please consult with a financial expert before making investment decisions.
Published on: Jul 8, 2024, 4:02 PM IST
We're Live on WhatsApp! Join our channel for market insights & updates

Get the link to download the App

