
The S&P 500 index has given a breakout from a consolidation last week and achieved a new all-time high at 4,903.68 on Thursday with positive sentiments. This breakout may propel the index more to 110 points upside.
On the support and resistance side, the levels of 4,604 and 4,538 can be seen as good support in case of adverse corrective actions. The resistance for the S&P500 remains uncertain as the index is at ATH.
The 20-day Exponential Moving Average (EMA) has proven to be a reliable support in previous trading sessions, it can act as a minor support in case of smaller drawdowns.
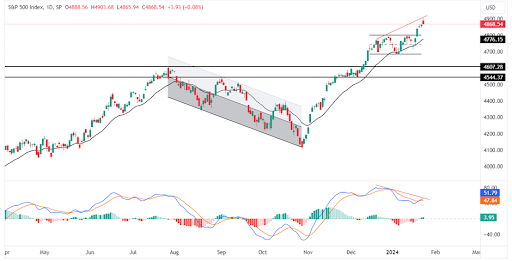
The MACD shows the divergence as reflected on the Relative Strength Index (RSI), where it is trading below the previous levels and the S&P500 is at its ATH, which creates signs of concern until the indicators get in sync with the spot price. It is better to remain cautious at the moment and trade according to levels.
Examining Treasury rates, they experienced an increase on Wednesday as investors sought a larger risk premium. This move followed data indicating an uptick in U.S. business activity in January, accompanied by signs of easing inflation. With critical data awaiting release and a Federal Reserve meeting on the horizon, the rise in Treasury rates reflects a cautious approach among investors.
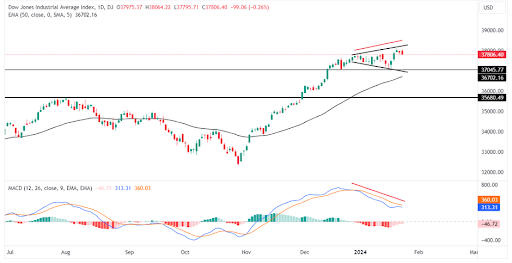
Looking at the daily chart of the DJI, it shows the start of the formation of a broadening wedge and the correction from the ATH to the bottom trendline of the wedge. If the down move gets an extension, a 50-day EMA may act as crucial support. But the overall scenario remains bullish at the time, and the indicators reflect the same story as the S&P 500, creating divergence. The strongest support is much below 35,687, and minor support lies at 37,100.
Nasdaq 100 climbed to the ATH this morning as solid results from Netflix boosted investor sentiment, while market participants also braced for U.S. business activity data and a deluge of corporate earnings reports.
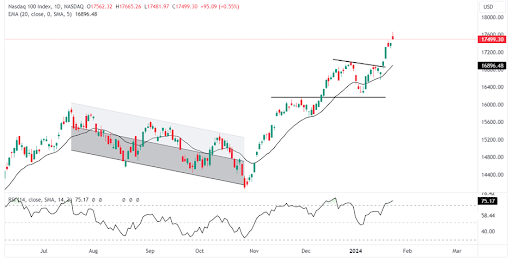
NASDAQ 100 is also declining from the ATH amid the surge in yields. The spot price looks like it is nearing the overbought zone and showing signs of a corrective move. The short-term support can be seen at the level of 17,000 in conjunction with the 20-day EMA. The Relative Strength Index (RSI) is at a level of 75.17, which is a bullish zone for trending. If the spot price of the NASDAQ 100 manages to trade above yesterday’s high, we may see a strong upmove with the support of strong economic indicators and earnings.
The recent milestones in the S&P 500, DJI Average Index, and Nasdaq 100 are met with cautious optimism. Technical indicators, while reflecting positive sentiment, also raise concerns about potential corrections. As investors navigate through evolving market conditions, a prudent approach, anchored in technical analysis, is recommended to mitigate risks and capitalize on emerging opportunities.
Disclaimer: This blog has been written exclusively for educational purposes. The securities mentioned are only examples and not recommendations. The information is based on various secondary sources on the internet and is subject to change. Please consult with a financial expert before making investment decisions.
Published on: Jan 25, 2024, 12:49 PM IST
We're Live on WhatsApp! Join our channel for market insights & updates

Get the link to download the App

