
Bharat Dynamics & Frog Cellsat are identified as upside potential stocks based on technical analysis. Both stocks have displayed promising structures and technical setups, including price volume contraction, and the potential to bounce back and breakout. Currently trading at Rs 1,617 and Rs 353 respectively, their price aligns with positive signals from technical indicators like RSI and ADX, suggesting a likely breakout scenario.
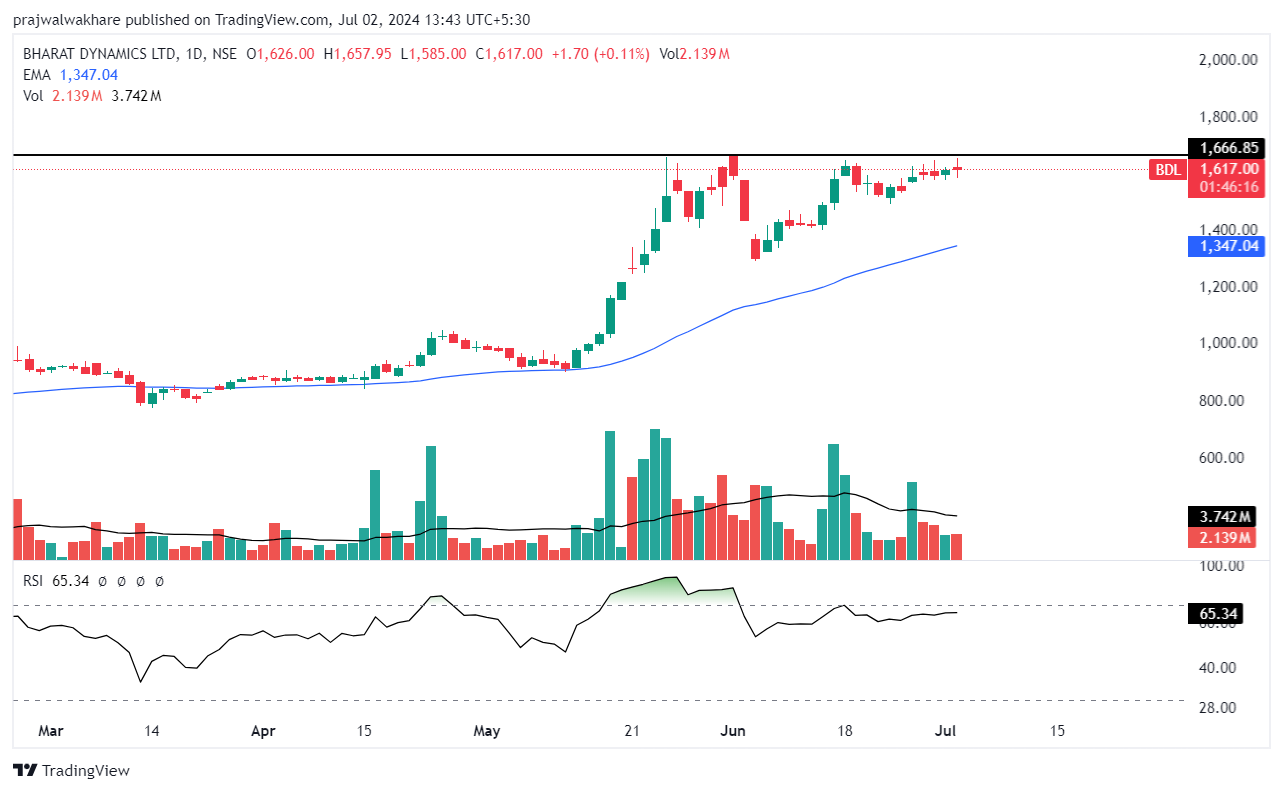
The daily chart of Bharat Dynamics Ltd
On the daily chart, Bharat Dynamics Ltd is presently showing a promising picture; the stock price is trading near 52-week high. The stock price may resume its strong momentum-up in the coming trading sessions if it manages to cross and close above the 52-week high marked on the chart, with the support of decent volume.
Those considering a possible trade-in Bharat Dynamics Ltd might purchase the stock at the current price with a stop loss of Rs 1,500 on a closing basis and aim to capitalize above the 52-week high.
The stock price is currently trading above its 50-day EMA, suggesting it is likely about to turn short-term bullish once more after the signs of substance above the current level. The stock appears bullish when one looks at the Relative Strength Index, which is now trading at 65. The ADX of 25 indicates the present state of price momentum, which is moving with good strong momentum.
In the event of a retracement, it is essential to monitor key support levels, particularly at Rs 1,500. The minor upper resistance is 52-week high and if the stock closes above resistances, then it may consistently trade above current levels.
Bharat Dynamics Ltd. engages in the manufacture of defences equipment.
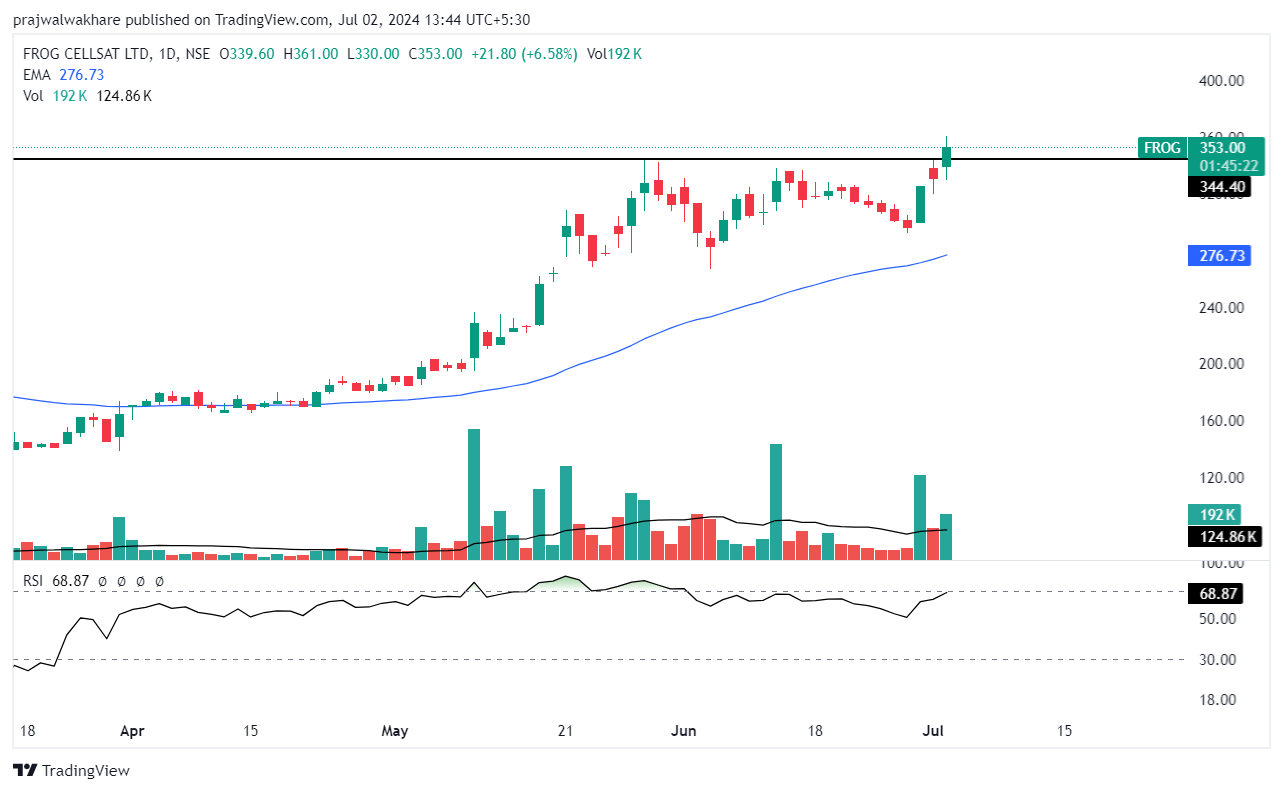
The daily chart of Frog Cellsat Ltd
Frog Cellsat Ltd’s current performance is indicated by a favorable technical setup. The company’s shares are now trading at Rs 353 and may start the uptrend from the current levels as it has given a breakout of the 52-week high. The stock price is currently trading above all the important moving averages.
Those interested in possible trade-in Frog Cellsat could purchase the stock at the present price, setting a stop loss below Rs 320, and aim for a target price higher than 12% to 15%.
The stock is trading above its all-important moving averages, and it is expected to find support near on 50-day EMA. The Relative Strength Index is trading near bullish levels at 68.87. This implies there may be potential for an increase in stock price strength. The ADX, now around 37, shows very strong momentum and directional strength.
The level at Rs 300 serves as a crucial indicator for corrective movement, and the overall market structure favors traders if the stock sustains the current level and trades above it.
Frog Cellsat Ltd. engages in the manufacture of telecommunications equipment.
Disclaimer: This blog has been written exclusively for educational purposes. The securities mentioned are only examples and not recommendations. The information is based on various secondary sources on the internet and is subject to change. Please consult with a financial expert before making investment decisions.
Published on: Jul 2, 2024, 6:38 PM IST
We're Live on WhatsApp! Join our channel for market insights & updates

Get the link to download the App

