These three equities gained significantly during Tuesday’s trading sessions, indicating strong bullish action.
Here’s an in-depth look.

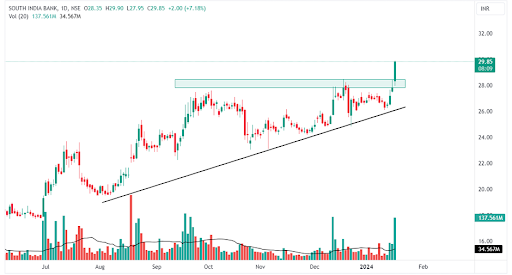
South Indian Bank has recently demonstrated a notable volume-price breakout, accompanied by a 52-week high breakout. Currently valued at Rs 29.85, the stock has experienced a significant surge in trading activity. The breakout is particularly noteworthy, supported by a robust relative strength index (RSI) trading at 73.85 on a daily basis, indicating the continuation of a new bullish trend. Trading at its all-time high, the next level of resistance for the stock remains uncertain. It is noteworthy that this stock has delivered impressive returns of 60.11% to investors in the last one year.
South Indian Bank Ltd is engaged in the provision of commercial banking services.

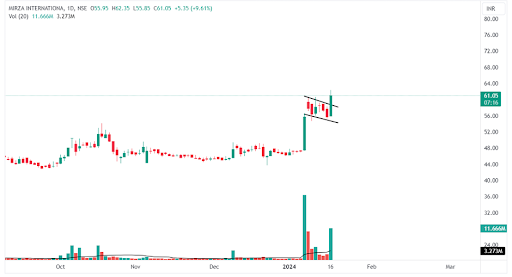
Mirza International has recently witnessed a substantial price bounce back, coinciding with the pullback from strong support at the previous strong level and the formation of a flag and pole chart pattern. Presently valued at Rs 61.05, the stock has experienced heightened trading activity today. The price action is supported by a neutral relative strength index (RSI) trading at an overbought level of 75.09, indicating the potential initiation of a positive trend. With a noteworthy return of 27.62% in the last one month, the stock is exhibiting a positive trajectory.
Mirza International Ltd manufactures and exports leather and footwear products.

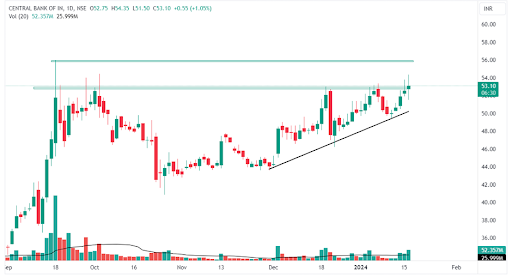
Shares of Central Bank of India demonstrated a notable price-volume breakout, marked by an indecision candle today, along with a prior high’s resistance breakout on the daily timeframe. The current daily relative strength index (RSI) stands at 65.57, signalling a continuation. The surge in volume, coupled with the specific chart pattern formation, indicates heightened trader interest. With an upper resistance breakout, the stock has given the ascending triangle breakout in conjunction with the basing chart pattern.
Central Bank of India engages in the provision of commercial banking products and services.
Disclaimer: This blog has been written exclusively for educational purposes. The securities mentioned are only examples and not recommendations. The information is based on various secondary sources on the internet and is subject to change. Please consult with a financial expert before making investment decisions.
Published on: Jan 16, 2024, 5:05 PM IST
We're Live on WhatsApp! Join our channel for market insights & updates
