
These three equities gained significantly during Friday’s trading sessions, indicating strong bullish action.
Here’s an in-depth look.
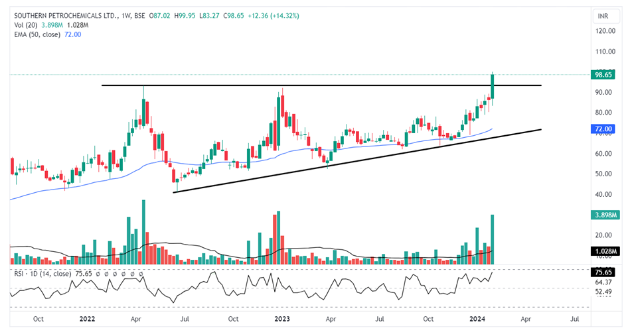
Southern Petrochemical Industries Corp’s stock is showing strong potential based on technical analysis. It recently experienced a Price Volume Breakout and an ascending triangle breakout, indicating a robust bullish sentiment. The stock is currently trading by the support of its 50-day exponential moving average, which is a positive sign.
The presence of a Bullish long-range candle on a weekly timeframe further supports the idea of a potential shift from a previous sideways trend. The Relative Strength Index (RSI) at 75.65 suggests a new bullish trend, possibly signalling the beginning of an uptrend. Additionally, the observed increase in trading volume and successful all-time high breakout add confirmation to the short-term bullish momentum.

TAKE Solutions’ stock is showing promising technical signals. It recently broke out resistance with increased trading volume and surpassed its 52-week high, signalling positive market sentiment. The stock is trading above short-term key moving averages, indicating strength. Breaking through upper resistance further supports a bullish outlook, hinting at the start of a new uptrend.
The Relative Strength Index (RSI) at 68.15 suggests a healthy uptrend without being overbought. A notable increase in trading volume, along with a successful upthrust and Friday’s opening, strengthens the technical position, indicating a potential for more upside till the 20-day EMA on the weekly chart. The stock is just turning up from its all-time low, this is the bottom fishing moment if the stock price picks from here.

Shree Renuka Sugars looks set for a positive move based on its technical indicators. The recent Price Volume surge with a bounce from the demand zone, coupled with the short-term moving averages cross, suggests an upward momentum. The break of the 20-day and 50-day EMA supports the stock’s overall strength.
The RSI at 65.52 shows a balanced trend without extreme conditions. A long green candle on Friday signals the beginning of a potential uptrend, backed by increased market participation as seen in the volume spike. In summary, Shree Renuka Sugars seems well-positioned for a potential upward movement till the supply zone is marked on the daily chart above.
Disclaimer: This blog has been written exclusively for educational purposes. The securities mentioned are only examples and not recommendations. The information is based on various secondary sources on the internet and is subject to change. Please consult with a financial expert before making investment decisions.
Published on: Feb 2, 2024, 7:27 PM IST
We're Live on WhatsApp! Join our channel for market insights & updates

Get the link to download the App

