
These three equities gained significantly during Wednesday’s trading sessions, indicating strong bullish action.
Here’s an in-depth look.
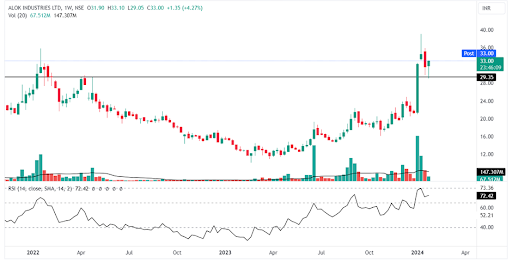
Weekly chart of Alok Industries Ltd
Alok Industries Ltd exhibits a compelling technical setup. The stock has demonstrated a Price Volume Breakout, signifying a strong bullish sentiment. Furthermore, it is currently trading above all key moving averages, reinforcing the positive outlook. The bounce back from the support level and the retest to the previous breakout level add to the bullish signals, indicating a potential continuation of the previous uptrend. The Relative Strength Index (RSI) at 72.42 implies a continuation of a bullish trend, suggesting the stock might be amid a strong uptrend. The observed volume spike on the daily chart successfully bounced from the 20-day Exponential Moving Average (EMA) and a robust support level adds confirmation to the bullish momentum for the longer term.
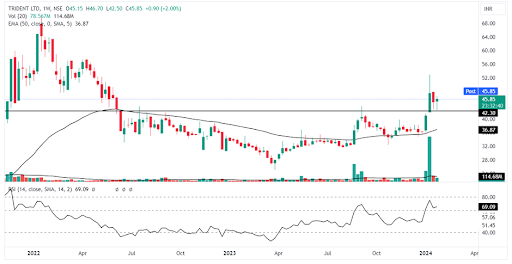
Weekly chart Trident Ltd
Trident Ltd presents an intriguing technical picture. The stock has witnessed a Price Volume Breakout along with a retest and bounce back from the previous breakout level, reinforcing positive market sentiment. Trading above all crucial moving averages is a strong indication of the stock’s strength. The retest at the breakout level further supports the bullish outlook, suggesting a continuation of the current uptrend. The RSI at 69.09 indicates a healthy uptrend without reaching an extreme overbought condition. A notable volume spike on a daily basis, coupled with a successful bounce from the strong support, solidifies the technical strength and potential for further upside.
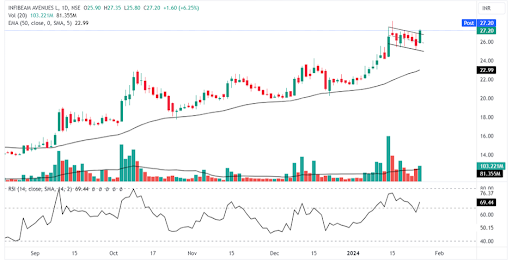
Daily chart of Infibeam Avenues Ltd
Infibeam Avenues Ltd portrays a promising technical scenario. The Price Volume Breakout, accompanied by the completion of the flag and pole chart pattern formation, suggests a renewed bullish momentum. The bounce from the 50-day EMA in the long term reinforces the stock’s strength. The RSI at 69.44 indicates a balanced trend without extreme conditions. The presence of a Wednesday’s long green candle adds a bullish trend start signal, supporting the notion of a potential uptrend. The observed volume spike further validates the bullish momentum, indicating increased market participation in the stock. Overall, Infibeam Avenues Ltd appears well-positioned for potential upside movement.
Disclaimer: This blog has been written exclusively for educational purposes. The securities mentioned are only examples and not recommendations. The information is based on various secondary sources on the internet and is subject to change. Please consult with a financial expert before making investment decisions.
Published on: Jan 24, 2024, 5:15 PM IST
We're Live on WhatsApp! Join our channel for market insights & updates

Get the link to download the App

