Long-term breakouts on weekly charts are an essential technical analysis pattern that traders and investors use to identify significant price movements. A breakout occurs when the price of an asset moves above a key resistance level or below a key support level, signalling a potential trend reversal or the continuation of an existing trend.
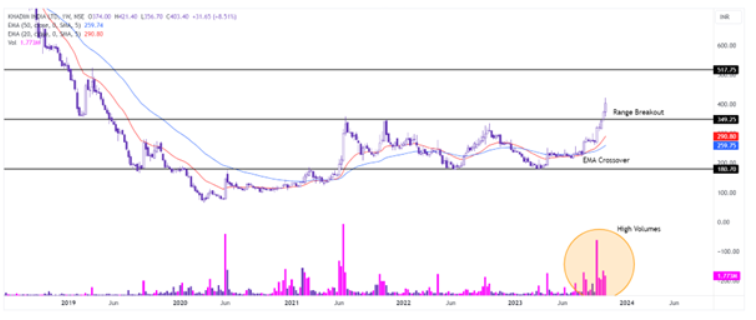
The chart of Khadim India Ltd has given a breakout from its 52-week high and a previous strong resistance. The stock was trading within the range of Rs. 180 to Rs. 350 for one year. One week ago, the stock broke out of this range and entered the next range of Rs. 350 to Rs. 520. This entire setup is supported by high-volume bars and a moving average crossover. In the month of August, the 20 EMA and 50 EMA gave a bullish signal for the stock price to surge. The stock has closed in the green for the last four weeks, creating four consecutive white candles. We can expect the price to touch the resistance of Rs. 517 soon, though pullbacks may occur as global market sentiments were bullish this week.
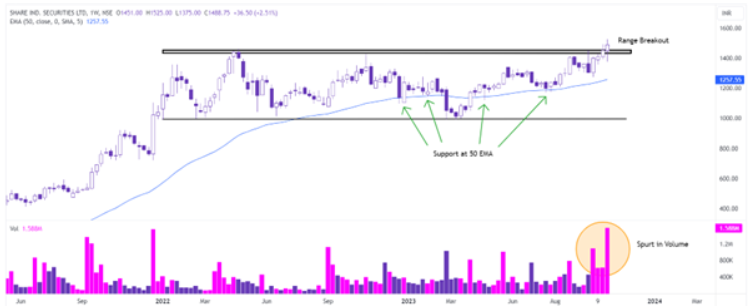
Share India’s stock has given a range breakout on the weekly chart and also a multi-year breakout. The stock was trading within a range of Rs. 1000 and Rs. 1450 for the last one and a half years. The range breakout is supported by high volumes and looks good to trigger the next rally for the stock. Furthermore, the stock price continuously finds support over the 50-period EMA and bounces back again. The company has shown a high level of profit growth on a year-on-year basis for the last five quarters.
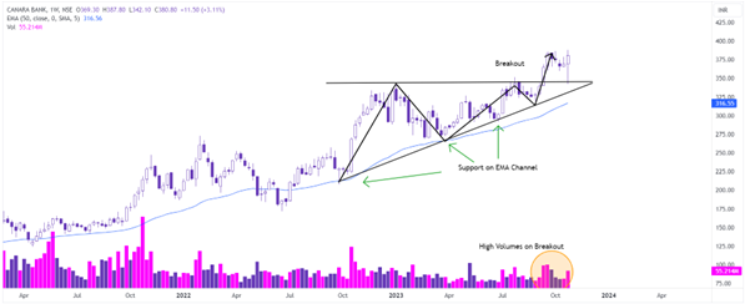
The chart of Canara Bank shows an ascending triangle pattern, which is a bullish chart pattern. The stock price of Canara Bank is already in an uptrend, so this chart pattern confirms the continuation of the uptrend. The price movement finds support over the 50 EMA with confirmation from high volumes. The stock has already given a breakout for the ascending triangle chart pattern, and this week, it tested a support level, which can be considered a confirmation sign. We are looking forward to bullish moves in the upcoming market trading sessions.
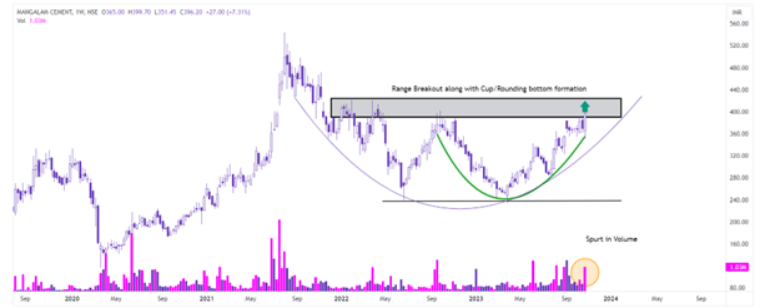
Mangalam Cement’s stock price has given a range breakout on the weekly chart. The stock is also in the process of completing a chart pattern known as a rounding bottom, which signals a breakout confirmation. The breakout candle of this week also has above-average volume. It appears that the trend will continue for a few weeks, potentially supported by a market bounce back, and may complete a sharp rally in the coming weeks.
Disclaimer: This blog has been written exclusively for educational purposes. The securities mentioned are only examples and not recommendations. It is based on several secondary sources on the internet and is subject to changes. Please consult an expert before making related decisions.
Published on: Oct 27, 2023, 7:44 AM IST
We're Live on WhatsApp! Join our channel for market insights & updates

Get the link to download the App

