
Nifty opened lower at 19,622 and extended its downward move to 19,480 within the initial hour of trading. Nifty gradually recouped some of the losses after the initial hour of trading but failed to turn green.
This pattern reflects a lack of strength in the market to sustain the highs. The support area on the weekly chart (10-week EMA) has been violated again on the downside at the 19,560 level. The overall chart pattern indicates a weak bias for Nifty going forward.
Nifty traded lower throughout the session and closed below the 50-day EMA (exponential moving average) but managed to defend the 19,500 mark on a closing basis.
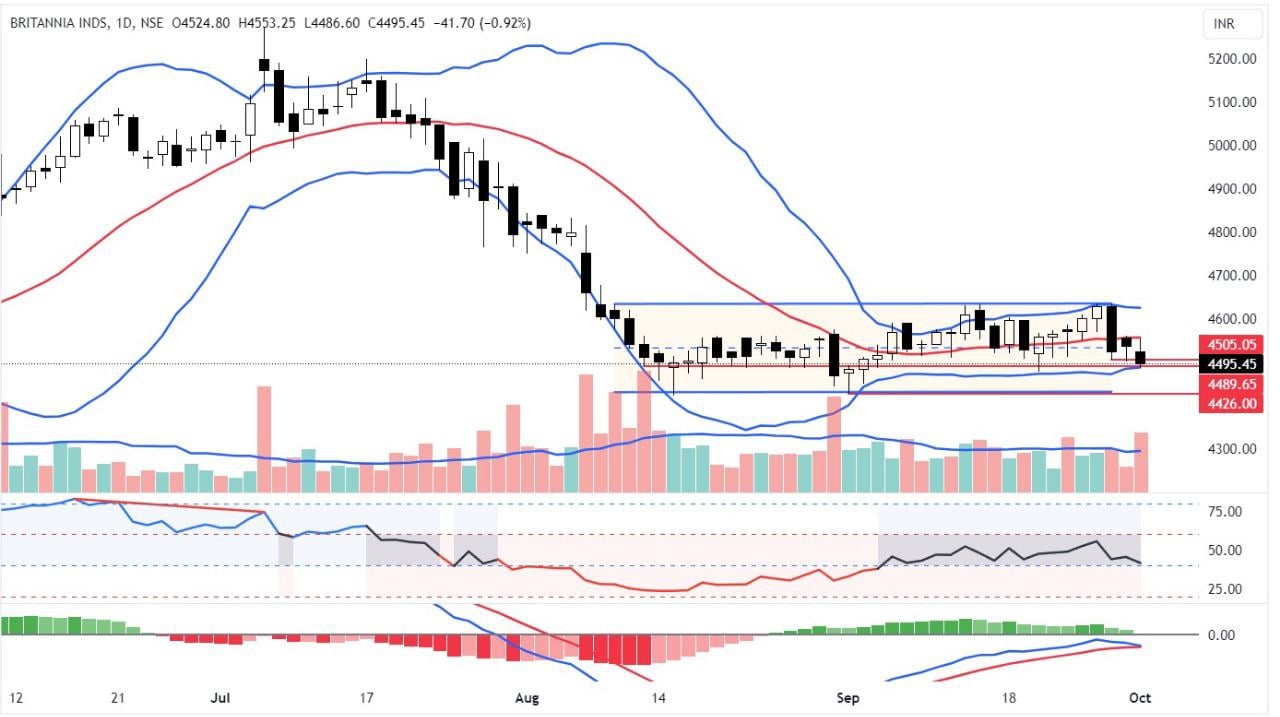
The Britannia Industries stock has been trading in a tight range and oscillating around the 20 DMA. It closed below the recent lows. The contraction in the Bollinger bands suggests a significant breakdown is possible. The stock is also trading below the 50 and 200 DMAs. The Elder’s impulse system has formed strong bearish bars. It is well below the Anchored VWAP support and Ichimoku cloud. The RSI is on the verge of shifting into the bearish zone. The MACD has given a fresh sell signal below the zero line. The KST and TSI indicators are in a bearish setup. In short, the stock is poised for a directional bias, so keep an eye on the level of Rs 4,489, as a move below this level would be negative for the stock.
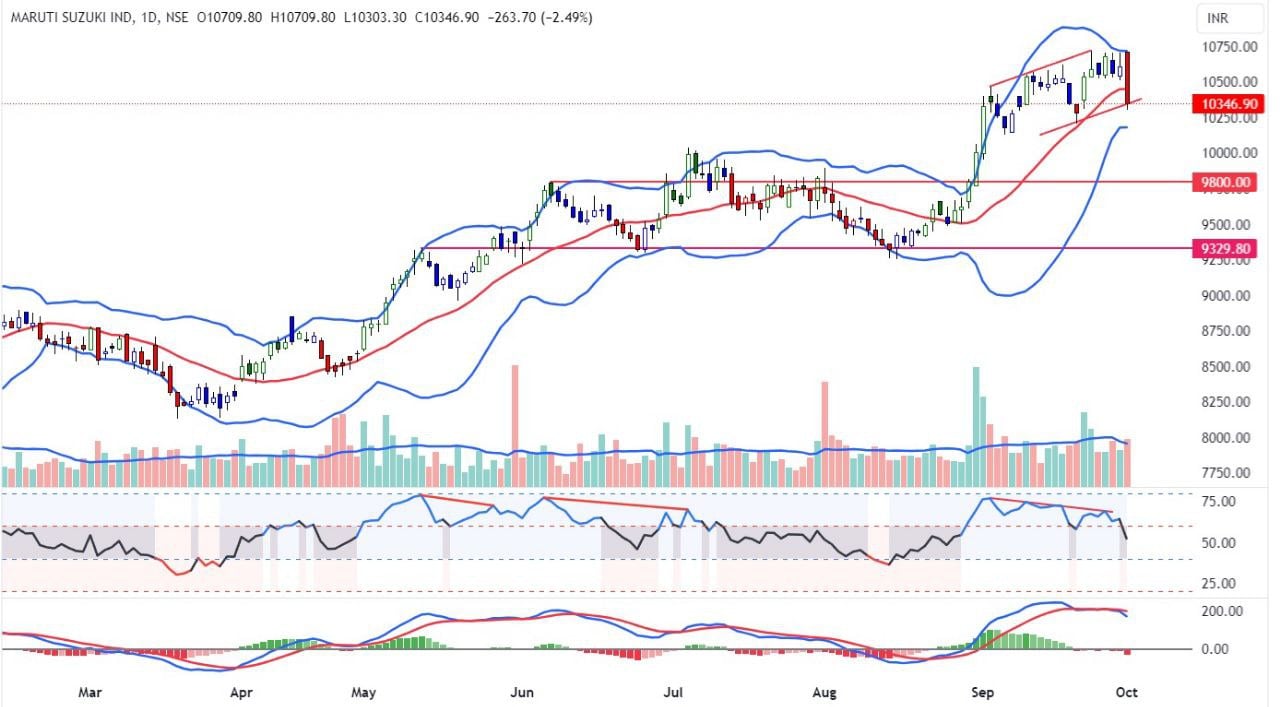
The Maruti Suzuki India stock sharply declined and formed the most bearish candle in recent times. It closed below the 20 DMA. The Elder’s impulse system has formed a strong bearish candle. The MACD has given a fresh sell signal. The RSI has received confirmation of its bearish divergence. The Bollinger bands have narrowed, indicating a possible impulsive move on the downside. The KST and TSI indicators have also given fresh bearish signals. The stochastic oscillator also shows bearish signals. In short, the stock closed at a crucial support level. A move below Rs. 10,340 is negative for the stock.
Disclaimer: This blog has been written exclusively for educational purposes. The securities mentioned are only examples and not recommendations. It is based on several secondary sources on the internet, and is subject to changes. Please consult an expert before making related decisions.
Published on: Oct 4, 2023, 8:29 AM IST
We're Live on WhatsApp! Join our channel for market insights & updates

Get the link to download the App

