
Nifty formed a Dragonfly Doji candlestick on the daily chart, indicating indecisiveness among bulls and bears. However, generally, such a pattern is formed after a consistent fall, suggesting the possibility of a reversal in the trend.
Nifty opened at 19,446 and remained volatile throughout the day, reaching a high of 19,458 and dipping to a low of 19,334. It ended the day 93 points down at 19,436.
Nifty extended its losses for the second day, influenced by weak global cues and continued FII selling, as a stronger dollar and rising US treasury yields contributed to risk-off sentiment.
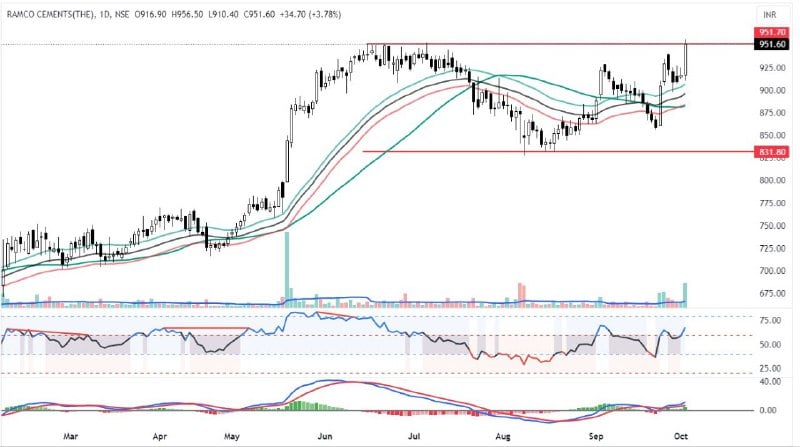
The Ramco Cements stock closed at a 52-week high with strong volume. It closed just above the previous pivot point and broke out of a 75-day consolidation. The moving average ribbon is in an uptrend. It is currently 7.83% above the 50 DMA and 5.40% above the 20 DMA. The MACD shows bullish momentum and is above the zero line. The RSI is in a strong bullish zone. Even in strong bearish market conditions, the stock exhibits higher relative strength. The KST and the TSI have maintained a strong bullish setup. The Elder’s impulse system has formed a strong bullish bar. It has cleared the Anchored VWAP resistance and is trading well above the Ichimoku cloud. In short, the stock has broken out of its consolidation. A move above Rs. 954 is considered positive.
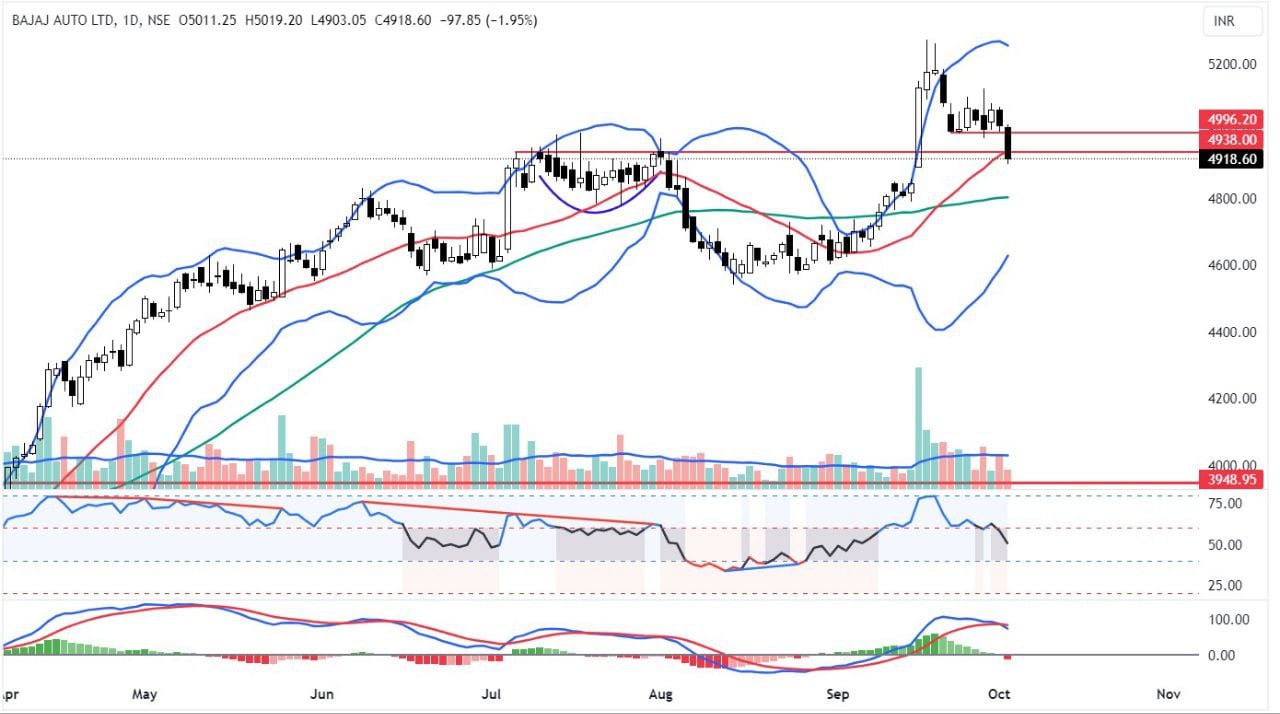
The bajaj auto stock experienced a sharp decline after six days of a tight trading range. It closed below the 20 DMA with a large bearish candle and is within the moving average ribbon. The MACD has generated a fresh sell signal. The RSI has declined from a strong bullish zone into the neutral zone. The Elder’s impulse system has formed a strong bearish bar. The Bollinger Bands are beginning to contract. The TSI has given a fresh bearish signal, and the KST is on the verge of issuing a sell signal. In short, the stock has broken out of its tight trading range. A move below Rs. 4,915 is considered negative for the stock.
**Disclaimer:** This blog is written exclusively for educational purposes. The mentioned securities are provided as examples and not as recommendations. The information is based on several secondary sources on the internet and is subject to change. Please consult an expert before making any related decisions.
Published on: Oct 5, 2023, 9:08 AM IST
We're Live on WhatsApp! Join our channel for market insights & updates

Get the link to download the App

