
Nifty formed a bullish candlestick pattern with minor upper and lower shadows on the daily chart, though it failed to hold above the 20-day EMA (exponential moving average placed at 19,662).
Nifty saw a gap-up opening for yet another session at 19,621 and climbed higher as the day progressed to hit an intraday high of 19,678 in the last hour of trade. Nifty settled at 19,654, up 108 points.
On the weekly chart, Nifty has a small-bodied bullish candlestick pattern with a long lower shadow and a minor upper shadow, resembling a Hammer-type candlestick pattern after a couple of weeks of correction. This is a bullish reversal pattern. Hence, if the index sees strong positive trade in the following session, there will be confirmation for further upside going ahead.
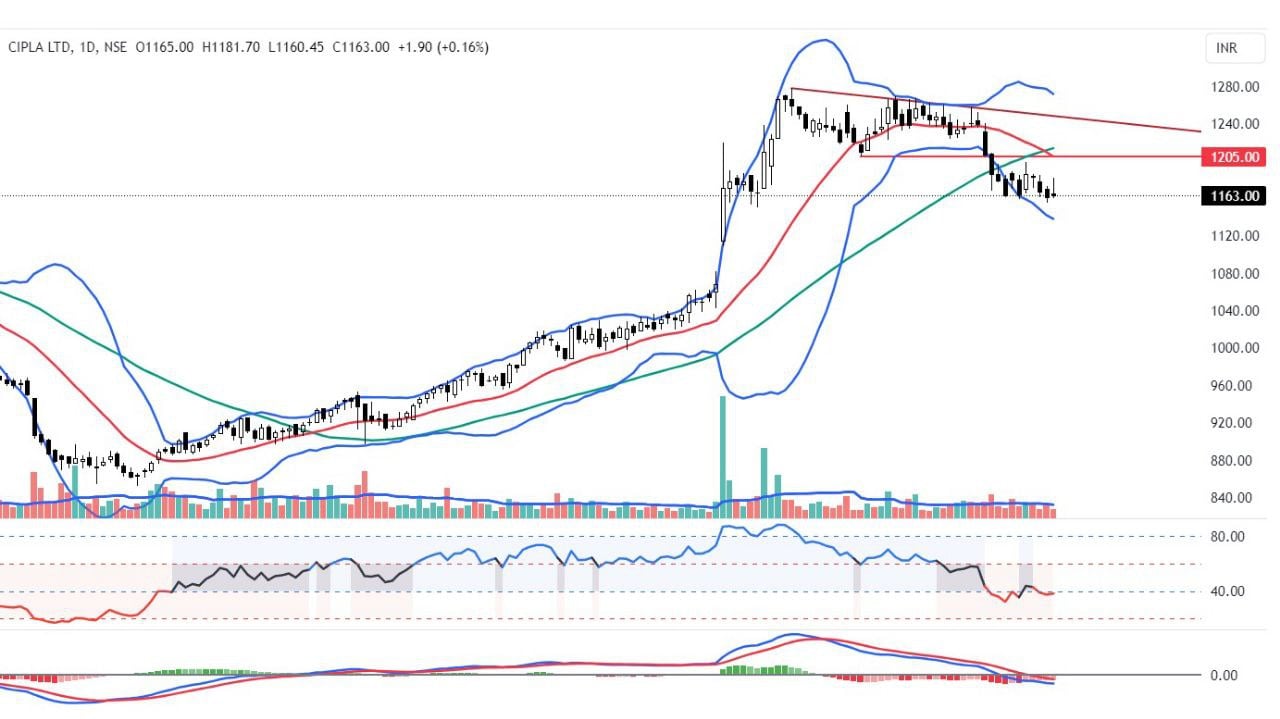
The cipla stock closed at a crucial support level. It formed a bearish candle and declined below the 23.6% retracement level of the prior uptrend. Additionally, it is trading below all the key moving averages, with the 20 DMA closing below the 50 DMA. The stock is 4.18% below the 50 DMA, and the moving average ribbon is in a downtrend. The MACD is below the zero line, and the RSI has declined into the bearish zone. The Elder’s impulse system has formed a neutral candle, and both the KST and the TSI are in bearish mode. Stochastic RSI has given a sell signal. In short, the stock closed at a crucial support level, and a move below Rs. 1,161 is negative, with the next support seen at the level of Rs. 1,115.
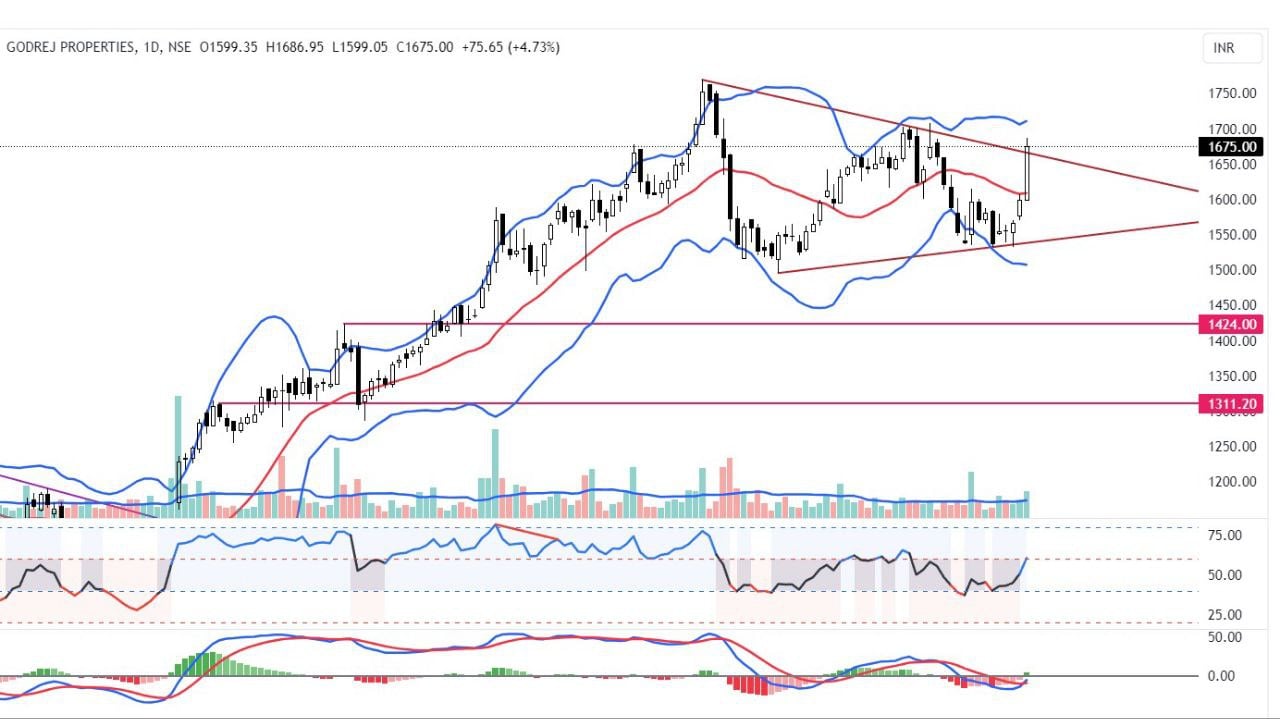
The godrej properties stock has broken out of a symmetrical triangle pattern, and the higher volume validates the breakout. It decisively closed above the 20 DMA and is currently 4.07% above the 50 DMA. The MACD has given a fresh bullish signal, and the RSI moved above 60, shifting into the strong bullish zone. The Elders Impulse system has formed a strong bullish signal, and both the KST and the TSI are in a bullish setup. Stochastic RSI has given a fresh bullish signal. The stock also closed above the Anchored VWAP and is above the Ichimoku cloud. In short, the stock has registered a bullish breakout, and a move above Rs. 1,675 is positive, with the potential to test the level of Rs. 1,710.
Disclaimer: This blog has been written exclusively for educational purposes. The securities mentioned are only examples and not recommendations. It is based on several secondary sources on the internet and is subject to changes. Please consult an expert before making related decisions.
Published on: Oct 9, 2023, 8:24 AM IST
We're Live on WhatsApp! Join our channel for market insights & updates

Get the link to download the App

