
Shanthi Gears, a subsidiary of Tube Investments of India, stands as a pioneering force in the field of gear
manufacturing and ranks among the top gear manufacturers in India today. With a rich history spanning over four decades,
Shanthi Gears has earned its place as the preferred provider of gear and gearbox solutions for some of the industry’s
leading names. The company’s unwavering commitment lies in delivering precision engineering, unwavering quality, and
comprehensive solutions. As a publicly listed company, Shanthi Gears remains at the forefront of its industry, driven by
a philosophy centered on continual innovation to ensure its relevance to customers. It is this spirit of innovation that
enables the company to offer even greater value. Shanthi Gears offers a wide spectrum of products and services,
including cutting-edge gear solutions tailored to a diverse range of applications and specialized gear reconditioning
services. In the realm of customized products, the company boasts a dominant market presence.
Gear products are classified as:
(A) Standard Gears—manufactured with standard specifications and catered in large volumes. Standard gearboxes can be
delivered in one to two months.
(B) Customized gears—manufactured according to the client’s specific requirements and involving an element of design
unique to the application needs. Therefore, the customized gearboxes take longer duration to manufacture and attract
less competition in the market. Over the years, the company has developed competence in delivering unique gearboxes that
were first time manufactured in the country. A high proportion of customized products (70% of mix in FY 22) aids the
company in maintaining a high operating margin and customer retention. The parent company of SGL, Tube Investments, is
planning to invest Rs 1,000 Crore in its electric vehicle venture and intends to leverage SGL’s expertise to produce
gearboxes for electric vehicles. We anticipate that SGL, with its comprehensive capabilities, diverse skillset, and
capacity to innovate and introduce new products and solutions across various industry verticals, is well-positioned to
reap significant benefits from the upsurge in the electric vehicle industry.
Overall, the company’s financial performance for the quarter was strong, with sales and EBITDA growing by 24.52% and
29.39% year-over-year, respectively. This is impressive growth, especially considering the challenging economic
environment. The company’s EBITDA margin, which is a measure of profitability, remained relatively stable at 24.12%,
compared to 23.22% in the previous year’s quarter. This indicates that the company is able to generate a good level of
profit margin on its sales. The company’s net profit after tax (PAT) grew by 26.63% year-over-year, reaching Rs 210.20
crore. This is a solid growth rate, showing that the company is capable of generating good cash flows from its
operations.
| Quarter ended | Year to Date | |||||
| Sep-23 (Rs crore) | Sep-22 (Rs crore) | % Var | Sep-23 (Rs crore) | Sep-22 (Rs crore) | % Var | |
| Sales | 1354.20 | 1087.50 | 24.52% | 2568.70 | 2076.00 | 23.73% |
| Other Income | 39.40 | 32.80 | 20.12% | 79.30 | 54.20 | 46.31% |
| EBIDTA | 326.70 | 252.50 | 29.39% | 597.60 | 455.10 | 31.31% |
| EBITDA margin | 24.12% | 23.22% | – | 23.26% | 21.92% | – |
| Interest | 0.00 | 0.00 | – | 0.00 | 0.00 | – |
| EBDT | 326.70 | 252.50 | 29.39% | 597.60 | 455.10 | 31.31% |
| Depreciation | 30.10 | 27.20 | 10.66% | 59.80 | 52.90 | 13.04% |
| PBT | 296.60 | 225.30 | 31.65% | 537.80 | 402.20 | 33.71% |
| TAX | 86.40 | 59.30 | 45.70% | 146.40 | 101.80 | 43.81% |
| Deferred Tax | 7.80 | 3.80 | 105.26% | 1.70 | -1.30 | -230.77% |
| PAT | 210.20 | 166.00 | 26.63% | 391.40 | 300.40 | 30.29% |
| NPM | 15.52% | 15.26% | – | 15.24% | 14.47% | – |
| Year End | FY23 | FY22 | FY21 | FY20 | FY19 | FY18 | FY17 | FY16 | FY15 | FY14 |
| Operational & Financial Ratios | ||||||||||
| Earnings Per Share (Rs) | 8.74 | 5.54 | 2.63 | 3.28 | 4.08 | 3.5 | 2.76 | 2.17 | 1.14 | 2.25 |
| CEPS(Rs) | 10.16 | 6.89 | 3.78 | 4.38 | 5.38 | 5.4 | 4.94 | 4.22 | 3.19 | 5.38 |
| Adjusted EPS (Rs.) | 8.74 | 5.54 | 2.63 | 3.28 | 4.08 | 3.5 | 2.76 | 2.17 | 1.14 | 2.25 |
| DPS(Rs) | 5 | 2.5 | 1.5 | 2 | 6 | 1 | 0.75 | 0.5 | 0.5 | 1 |
| Adjusted DPS(Rs) | 5 | 2.5 | 1.5 | 2 | 6 | 1 | 0.75 | 0.5 | 0.5 | 1 |
| Book NAV/Share(Rs) | 39.42 | 33.89 | 30.92 | 29.81 | 36.97 | 38.9 | 37.49 | 34.75 | 33.14 | 32.61 |
| Adjusted Book Value (Rs) | 39.42 | 33.89 | 30.92 | 29.81 | 36.97 | 38.9 | 37.49 | 34.75 | 33.14 | 32.61 |
| Tax Rate(%) | 25.66 | 27.69 | 22.63 | 22.94 | 21.46 | 13.84 | 21.02 | 23.41 | 28.91 | 29.12 |
| Dividend Pay Out Ratio(%) | 57.2 | 45.15 | 57.04 | 60.9 | 146.99 | 28.59 | 27.22 | 23.04 | 43.83 | 44.45 |
| Core EBITDA Margin (%) | 20.24 | 17.89 | 12.1 | 14.33 | 17.04 | 16.83 | 17.53 | 16.86 | 10.89 | 24.56 |
| EBIT Margin (%) | 20.32 | 17.49 | 12.21 | 13.57 | 17.63 | 15.18 | 14.05 | 12.76 | 7.86 | 15.39 |
| Pre Tax Margin (%) | 20.24 | 17.42 | 12.1 | 13.49 | 17.57 | 15.11 | 13.98 | 12.71 | 7.79 | 15.1 |
| PAT Margin (%) | 15.05 | 12.6 | 9.36 | 10.4 | 13.8 | 13.02 | 11.04 | 9.74 | 5.54 | 10.71 |
| Cash Profit Margin (%) | 17.49 | 15.68 | 13.47 | 13.86 | 18.19 | 20.1 | 19.79 | 18.91 | 15.5 | 25.62 |
| ROA (%) | 17.86 | 12.46 | 6.65 | 8.04 | 9.5 | 8.19 | 6.55 | 5.23 | 2.7 | 5.7 |
| ROE (%) | 23.85 | 17.09 | 8.66 | 9.49 | 10.76 | 9.16 | 7.63 | 6.39 | 3.47 | 7.02 |
| ROCE (%) | 32.21 | 23.73 | 11.3 | 12.39 | 13.74 | 10.68 | 9.7 | 8.38 | 4.92 | 10.09 |
| Asset Turnover(x) | 1.19 | 0.99 | 0.71 | 0.77 | 0.69 | 0.63 | 0.59 | 0.54 | 0.49 | 0.53 |
| Inventory Turnover(x) | 6.82 | 4.74 | 3.1 | 3.7 | 3.75 | 3.28 | 2.87 | 2.76 | 2.96 | 3.8 |
| Debtors Turnover(x) | 6.35 | 5.64 | 5.04 | 5.12 | 4.32 | 4.33 | 4.82 | 4.82 | 5.25 | 6.57 |
| Sales/Fixed Asset(x) | 3.15 | 2.51 | 1.75 | 2.21 | 2.41 | 2.37 | 2.35 | 0.81 | 0.46 | 0.47 |
| Working Capital/Sales(x) | 2.28 | 2.12 | 1.7 | 1.98 | 1.11 | 0.92 | 0.93 | 0.96 | 0.93 | 1.03 |
| Fixed Capital/Sales(x) | 0.32 | 0.4 | 0.57 | 0.45 | 0.41 | 0.42 | 0.43 | 1.24 | 2.18 | 2.11 |
| Receivable days | 57.49 | 64.75 | 72.41 | 71.33 | 84.57 | 84.3 | 75.68 | 75.78 | 69.55 | 55.53 |
| Inventory Days | 53.54 | 77.03 | 117.68 | 98.65 | 97.42 | 111.43 | 127.04 | 132.44 | 123.34 | 95.96 |
| Payable days | 74.72 | 108.21 | 149.54 | 96.22 | 92.37 | 98.46 | 122.75 | 135.74 | 120.65 | 77.74 |
| Total Debt/Equity(x) | 0 | 0 | 0 | 0 | 0 | 0 | 0 | 0 | 0 | 0 |
| Current Ratio(x) | 3 | 2.67 | 2.4 | 3.32 | 5.34 | 6.75 | 6.41 | 6.63 | 6.24 | 6.83 |
| Quick Ratio(x) | 2.32 | 2 | 1.54 | 2.16 | 3.95 | 5.33 | 4.55 | 4.65 | 4.34 | 5.15 |
| Interest Cover(x) | 244.76 | 245.71 | 109.63 | 173.05 | 304.29 | 222.13 | 220.23 | 290.38 | 120.18 | 52.86 |
| In Percentage | |||||||
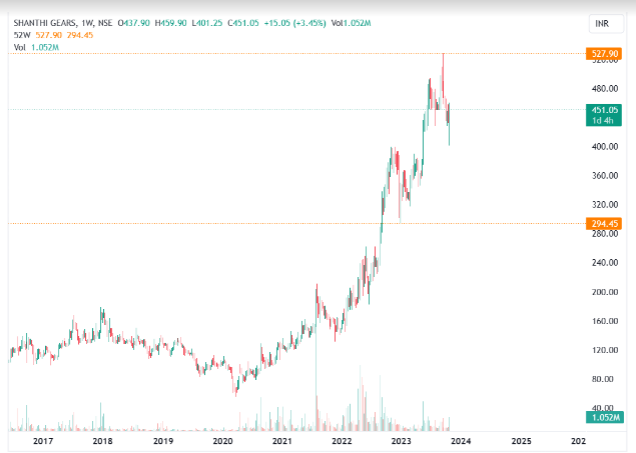
| Trading Date | LTP (Rs.) | 1 Day | 1 Month | 6 Months | 1 Year | 2 Years | 5 Years |
| 25-10-2023 | 448.70 | 8.04 | -2.77 | 28.04 | 22.88 | 192.03 | 302.60 |
The Indian automotive components sector plays a substantial role in fostering economic expansion and employment,
encompassing both structured and unstructured segments. The structured sector predominantly serves original
equipment
manufacturers (OEMs), while the unstructured sector caters to the aftermarket. Various subdomains encompass
components
such as motor components, transmission, and steering, among others. The industry has ambitious employment targets in
accordance with the Automotive Mission Plan (2016-26).
In the fiscal year 2023, the industry witnessed notable growth, manifesting a 33% surge in revenue to reach Rs 5.6
lakh
crore. This robust performance was primarily driven by strong domestic demand from OEMs and the aftermarket. Exports
also experienced an increase of 5.24% to $20.1 billion in FY23, albeit accompanied by a surge in imports,
particularly
in advanced technology components.
Positive growth catalysts include the sustained demand for domestic vehicles, the adoption of the “China+1” strategy
aimed at diversifying operations, and the rising popularity of electric vehicles. Government initiatives, including
subsidies, are fostering growth in the electric vehicle segment. A resilient Indian economy, projecting a GDP growth
rate of 6.5% in FY24, provides further underpinning for the industry’s growth.
However, the industry faces certain challenges, including economic downturns in key export markets like Europe and
the
United States and the imposition of high GST rates on specific automotive components. Industry advocates are pushing
for
a uniform 18% GST rate across all automotive components.
India is making significant strides in the global industrial landscape, with manufacturing emerging as one of the
high-growth sectors. The Government of India has introduced various measures to promote the expansion of the
manufacturing sector in the nation. Some noteworthy initiatives and developments include:
Continued investments by both government and private entities in end-user industries, such as power, automotive,
metals,
and mining, are anticipated to drive growth in the industrial gearbox market. Furthermore, the expansion of the
construction industry is expected to bolster the manufacturing and service market for industrial gearboxes.
Disclaimer: This blog has been written exclusively for educational purposes. The securities
mentioned are only examples and not recommendations. It is based on several secondary sources on the internet and
is
subject to changes. Please consult an expert before making related decisions.
Published on: Oct 26, 2023, 2:49 PM IST
We're Live on WhatsApp! Join our channel for market insights & updates

Get the link to download the App

