
Today, the Nifty50 index opened at 19297, marking a 90-point decrease from its previous day’s closing level of 19387. It began the day with a strong full-bodied red candle on the five-minute timeframe, indicating that despite the gap down, sellers are showing significant interest at these levels.
However, buyers were more dominant, pushing Nifty to upper levels. Not only did it surpass the first five-minute candle, but it also created an intraday high of 19340, which unfortunately remained the highest point throughout the session.
Around 10:00 AM, it started falling from the intraday high levels, breaking the support of the first five-minute candle and creating an intraday low of 19230, which thankfully was the lowest point throughout the day.
Throughout the session, it traded within these high and low points, amounting to a range of 110 points, and finally concluded the day at 19266.
On July 03, 2023, the Nifty crossed the 19300 level for the first time ever. Since that day, it has consistently closed above 19300. However, this record was broken today by closing below 19300.
Turning to the weekly data, Nifty opened the week at 19321, reached a high of 19584, a low of 19230, and ultimately closed the week in the red at 19266. This closing value is 44 points or 0.23% lower than the previous week’s closing level. The difference between this week’s high and low points was 319 points, compared to the previous week’s 173 points.
Observing the weekly candle, it features a long wick on the upper side, resembling an inverted hammer candle.
The Relative Strength Index (RSI) for Nifty stands at 41.48 on the daily timeframe, while on the weekly and monthly timeframes, it stands at 61.70 and 64.31, respectively. In both the weekly and monthly time frames, the RSI fell.
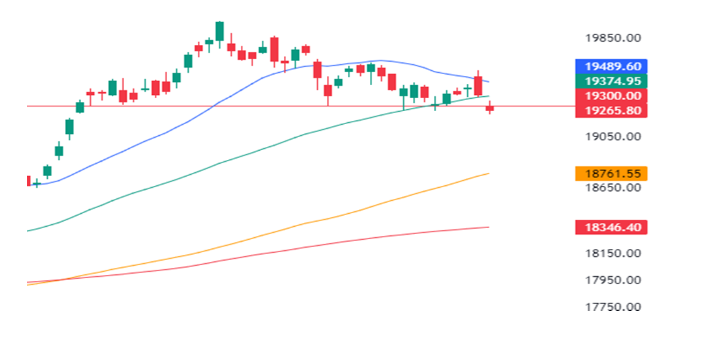
Furthermore, throughout the week, Nifty50 traded below the 20-day moving average and above other key moving averages, such as the 50-day, 100-day, and 200-day averages, on the daily timeframe. Moreover, it closed below the 50-day moving average today last Friday it took support on the same and closed almost at the 50-day moving average.
Considering the current weekly expiry set for August 31, the Call Open Interest is approximately 26.71 lakh, while the Put Open Interest stands at 17.95 lakh. Significant open interest is observed at the 19300 and 19400 Call strike prices. On the Put side, substantial open interest is noted at the 19300 and 19200 strike prices, suggesting that these levels may serve as immediate resistance and support for the upcoming expiry.
The Put Call Ratio (PCR) for Nifty50 currently stands at 0.67, according to data from the National Stock Exchange.
Disclaimer: This blog has been written exclusively for educational purposes. The securities mentioned are only examples and not recommendations. It is based on several secondary sources on the internet, and is subject to changes. Please consult an expert before making related decisions.
Published on: Aug 25, 2023, 6:35 PM IST
We're Live on WhatsApp! Join our channel for market insights & updates

Get the link to download the App

