
Nifty50, the most traded index on the NSE, has started falling since the beginning of this week, with four trading sessions, and Tuesday being a trading holiday. During all these trading days, Nifty fell and closed the session in the red.
Today, it opened the day at 19,745, hit an intraday high of 19,799, and a low of 19,657. It finally closed at 19,767, which is 0.34% or 68 points down from its previous day’s closing level of 19,742.
Moving on to the intraday chart analysis, it started the session with a big green bar in the five-minute time frame, suggesting that the previous day’s fall has come to an end here and is ready to move towards the upside from these levels. However, at 9:25 AM, it faced hurdles to even touch 19,800, and bears became aggressive, dragging the index below 19,700. Around 10:20 AM, it started recovering at a significant pace and encountered resistance again at the same levels near 19,800.
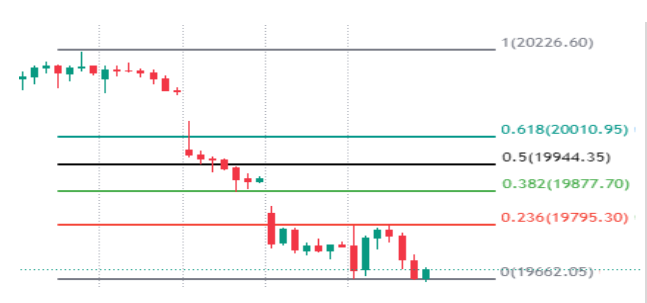
Interestingly, when we use the Fibonacci tool from the all-time high dated September 15 to today’s intraday low created around 10 AM, there was one important level near 19,800, which was a 23% retracement, and the index faced resistance exactly from those levels. It started falling from these levels around 12:30 noon and finally closed the session at today’s low point of 19,674.
Yesterday, it was taking support at the 50% Fibonacci level of the current bullish trend, marking from the August 31 low levels to the September 15 high levels.
Calculating the difference between today’s high and low, we find that it traded within a range of 142 points. Looking at today’s candle, there is a long wick on the upper side of the candle, suggesting that the index faced significant downward pressure at the upper levels.
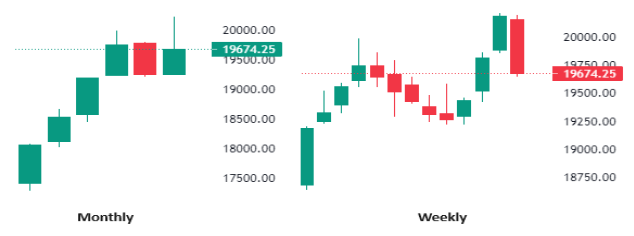
Shifting your focus to the weekly data, the Nifty opened the week at 20,156, reached a high of 20,195, dipped to a low of 19,657, and closed the week in the red at 19,674. This closing value represents a 518-point decrease, or 2.57%, compared to the previous week’s closing level. Regarding the current weekly candle, it is a robust red bar that covers more than 50% of the three weeks’ rally.
When examining the monthly candle, there is a long wick on the upper side of the candle, and it appears to be a bearish hammer candle.
The Relative Strength Index (RSI) stands at 48.24 on the daily timeframe, while on the weekly and monthly timeframes, it stands at 61.45 and 66.17, respectively. On every timeframe, the RSI has deteriorated.
Furthermore, the Nifty50 has closed above all key moving averages, including the 50-day, 100-day, and 200-day averages, on the daily timeframe except 20-day.
Considering the current monthly expiry set for November 28, the Call Open Interest is approximately 23.21 lakhs, while the Put Open Interest stands at 18.93 lakhs. Significant open interest is observed at the 19,700 and 19,800 Call strike prices. On the Put side, substantial open interest is noted at the 19,600 and 19,500 strike prices, suggesting that these levels may serve as immediate resistance and support for the upcoming expiry.
The Put Call Ratio (PCR) currently stands at 0.81, according to data from the National Stock Exchange.
Disclaimer: This blog has been written exclusively for educational purposes. The securities mentioned are only examples and not recommendations. It is based on several secondary sources on the internet and is subject to changes. Please consult an expert before making related decisions.
Published on: Sep 22, 2023, 6:23 PM IST
We're Live on WhatsApp! Join our channel for market insights & updates

Get the link to download the App

