Technical & Derivatives Report
May 26, 2016
Sensex (25881) / Nifty (7935)
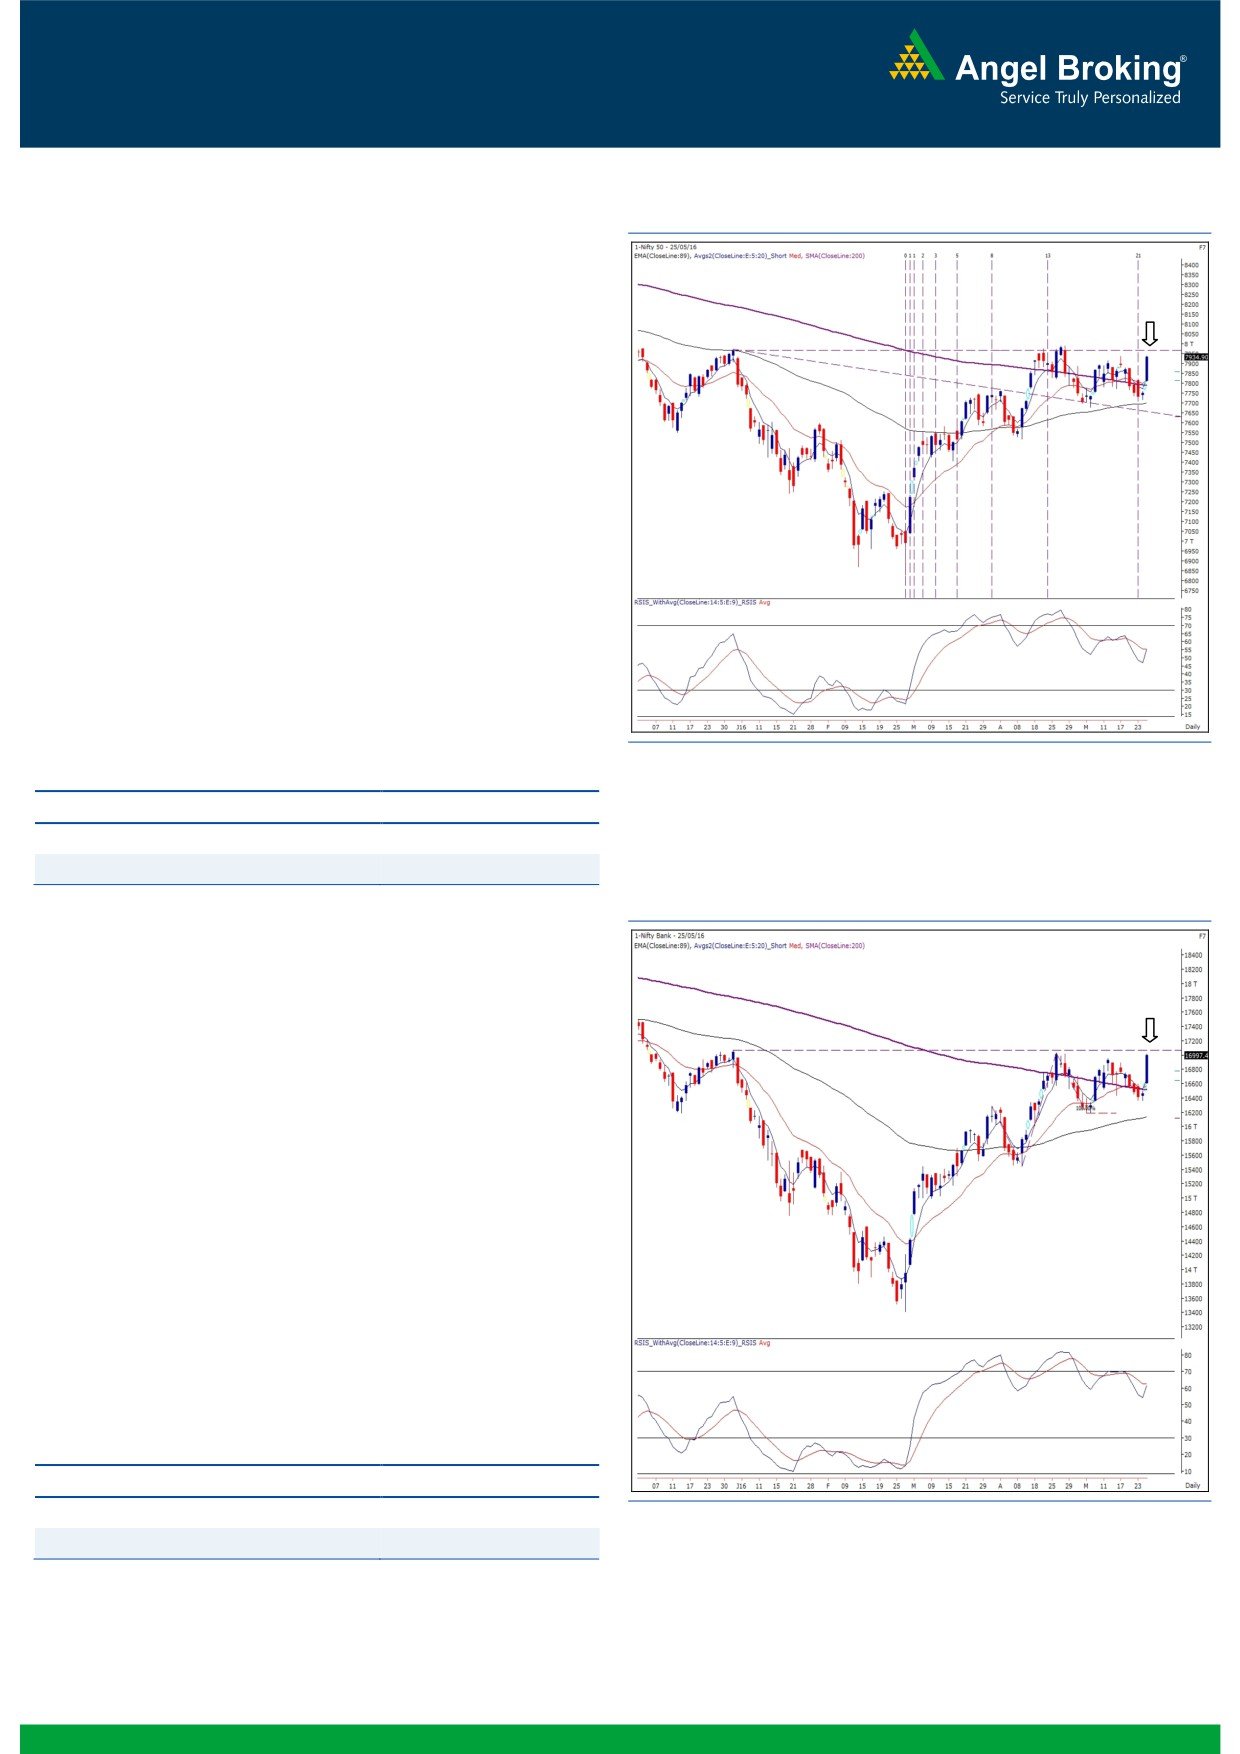
Exhibit 1: Nifty Daily Chart
After such a prolonged consolidation, we witnessed an amazing
trading day (especially for the bulls) as the index opened with a
decent upside gap mirroring to extremely positive global cues and
then a strong follow up buying to conclude the day with whopping
single day gains of 2.40%.
To be honest, we were not so surprised with yesterday’s move as
we have been repeatedly mentioning about a probable bounce
after Nifty entering the 9th ‘Time Zone’ (34 Days) as per the
‘Fibonacci Time Series’. Our mentioned targets have been met;
but, still the momentum is quite strong and thus, traders should
not expect any fall immediately. Since, the May series derivative
expiry is slated today, traders need to keep a close watch on two
key levels, which are 7950 and 8000. Sooner or later, we expect
it to be broken; but, whether it’ll happen tomorrow or not is very
difficult to comment on. However, having said that we maintain
our positive stance on the market and expect 7900 - 7880 to act
as an immediate support in the coming session.
Key Levels
Support 1 - 7900
Resistance 1 - 7950
Support 2 - 7880
Resistance 2 - 8000
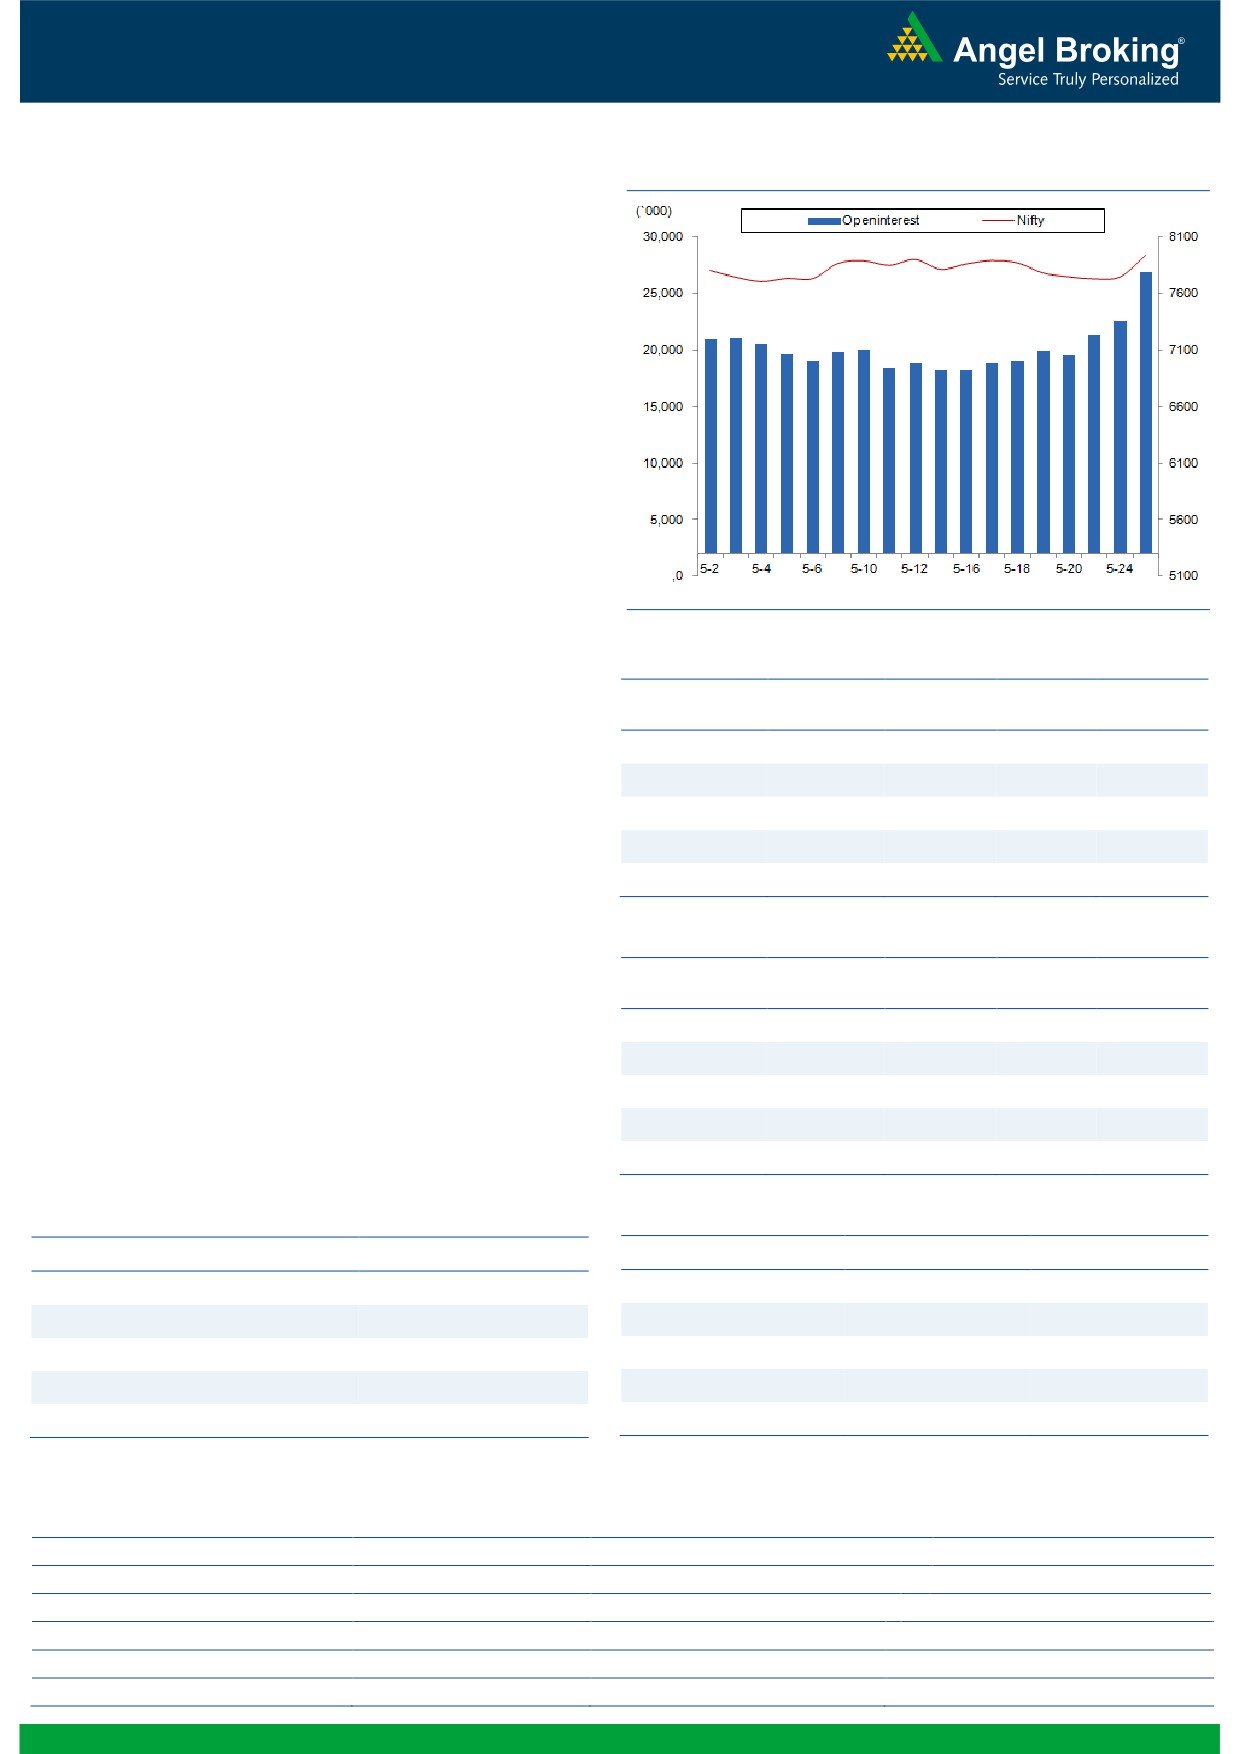
Exhibit 2: Nifty Bank Daily Chart
Nifty Bank Outlook - (16997)
The Nifty Bank index opened gap up and rallied throughout the
session to end the day with enormous gains of 3.29% over its
previous close.
The Nifty Bank index has formed a bullish 'Marubozu' candle on
daily charts, indicating that buyers were in complete control right
from the opening tick. The pullback was much on our expected
lines as we had already mentioned in our previous reports that
the banking index has formed 'Bullish AB=CD' pattern around
16370 no hourly chart and an up move should eb there. In recent
past, 17000-17080 zone has acted as resistance several times
since December 2015. Hence, for continuation of the positive
momentum, the bulls need to lead the index above the mentioned
resistance zone. Traders are advised to continue with the long
positions in the index unless any signs of reversal seen. The
intraday support for the index is placed around 16870 and
16750 whereas resistance are seen around 17080 and 17210.
Key Levels
Support 1 - 16870
Resistance 1 - 17080
Support 2 - 16750
Resistance 2 - 17210
1
Technical & Derivatives Report
May 26, 2016
Comments
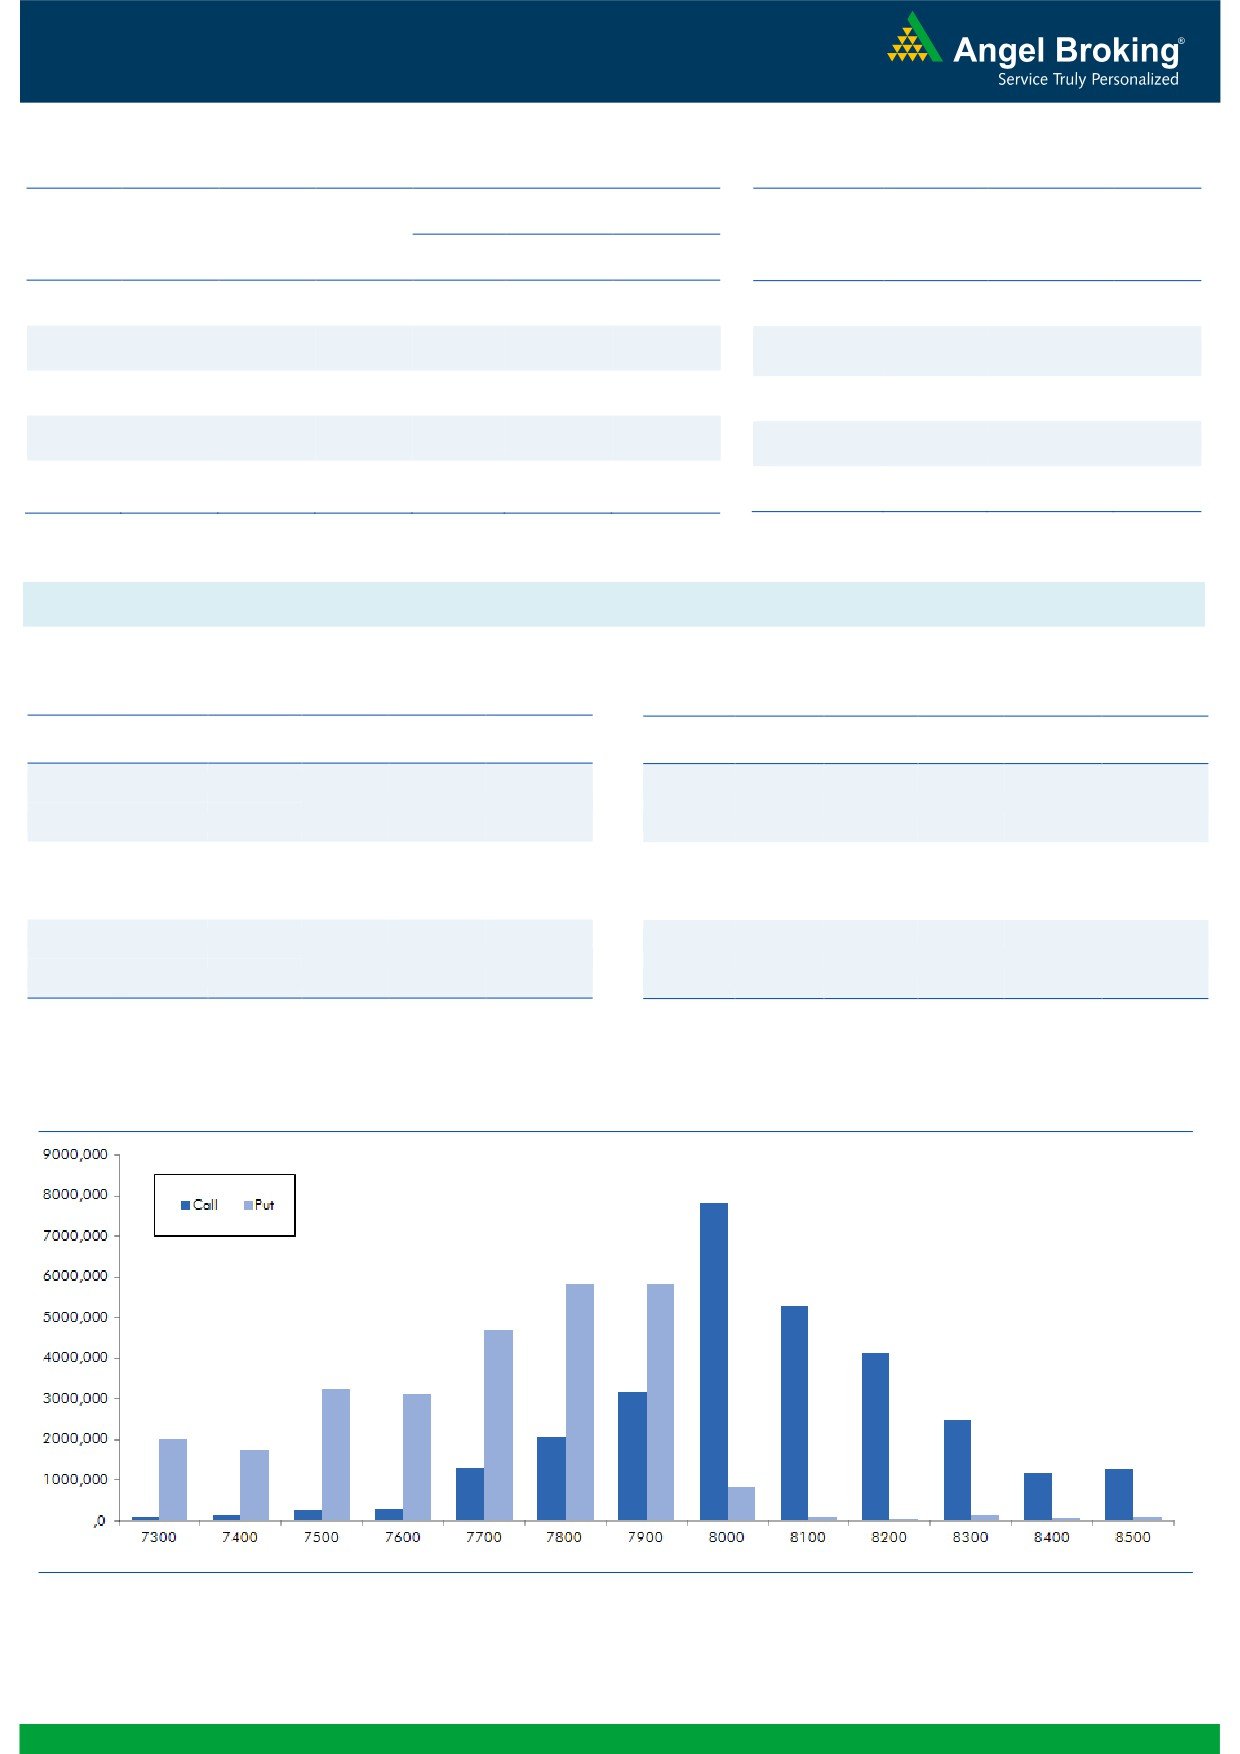
Nifty Vs OI
The Nifty futures open interest has increased by 18.92%
BankNifty futures open interest has increased by 12.58%
as market closed at 7934.90 levels.
The Nifty May future closed at a premium of 8.10 points
against a premium of 10.45 points. The June series
closed at a premium of 19.05 points.
The Implied Volatility of at the money options has
decreased from 15.05% to 14.99%.
The total OI of the market is Rs. 2,64,058/- cr. and the
stock futures OI is Rs. 68,938/- cr.
Few of the liquid counters where we have seen high cost
of carry are IDBI, CEATLTD, GMRINFRA, GODREJIND
and BANKBARODA.
Views
Nifty bounced more than 2 percent yesterday; FIIs too
participated in this move in a big way. They bought
OI Gainers
equites to the tune of Rs. 495 crores. While in Index
OI
PRICE
SCRIP
OI
PRICE
Futures, they bought significantly of Rs. 3343 crores with
CHG. (%)
CHG. (%)
GODREJCP
402000
33.11
1459.60
4.58
huge amount of rise in OI, suggesting long formation.
On the other hand in options front, they were net buyers
VOLTAS
8335600
28.98
337.80
3.13
of worth Rs. 2392 crores with marginal change in open
IBREALEST
28694000
25.72
94.65
5.28
interest. We believe FIIs have covered most of the short
RECLTD
36524000
18.12
155.50
0.45
formed in 7800 and 7900 call options. 8200 and 8300ng.com
INFRATEL
5496400
17.97
395.95
3.10
call options of June series were most active and they also
added good amount of OI yesterday. While in put
OI Losers
options, 8000-7950 strikes added meaningful build-up,
OI
PRICE
these positions are mostly on the short side. Seeing
SCRIP
OI
PRICE
CHG. (%)
CHG. (%)
yesterday’s statistic, we believe Nifty may continue to
CANBK
10030000
-14.95
193.55
7.35
show strength, one can expect Nifty testing 7980-8000
JUSTDIAL
2511400
-14.75
640.80
0.16
levels today. Rollover in Nifty is below its averages at
CASTROLIND
9177100
-14.25
372.55
1.91
55.35% and of BankNifty is in line at 46.64%. Rollover
TATAGLOBAL
22138500
-13.00
119.50
-2.05
percentage in NIFTY suggests shorts which were formed
in May series are not getting rolled for next series.
UNIONBANK
15110000
-12.47
109.55
2.48
Historical Volatility
Put-Call Ratio
SCRIP
HV
SCRIP
PCR-OI
PCR-VOL
TECHM
52.83
NIFTY
1.03
0.94
INDUSINDBK
31.07
BANKNIFTY
1.20
0.88
CIPLA
34.13
SBIN
0.45
0.50
AMARAJABAT
36.01
RELIANCE
0.51
0.61
ASHOKLEY
34.24
ICICIBANK
0.65
0.41
Strategy Date
Symbol
Strategy
Status
02-05-2016
NIFTY
Long Strangle
Active
09-05-2016
RELIANCE
Long Put
Loss Booked on 17th May
16-05-2016
LT
Short Strangle
Marginal Profit Booked on 24th May
23-05-2016
RCOM
Long Straddle
Active
2
Technical & Derivatives Report
May 26, 2016
FII Statistics for 25-May 2016
Turnover on 25-May 2016
Open Interest
No. of
Turnover
Change
Detail
Buy
Sell
Net
Instrument
Value
Contracts
( in Cr. )
(%)
Contracts
Change (%)
(in Cr.)
INDEX
INDEX
10952.14
7608.73
3343.42
384841
22504.78
26.96
605062
34280.87
95.79
FUTURES
FUTURES
INDEX
INDEX
48552.77
46160.32
2392.45
1241305
72943.48
(0.60)
8115185
468933.20
67.63
OPTIONS
OPTIONS
STOCK
21558.96
21391.33
167.63
1140354
54593.42
3.33
STOCK
FUTURES
1539763
74093.91
36.41
FUTURES
STOCK
STOCK
3965.70
4162.00
(196.30)
111602
5403.65
2.79
OPTIONS
521828
26044.93
41.33
OPTIONS
TOTAL
85029.58
79322.38
5707.20
2878102
155445.32
4.13
TOTAL
10781838
603352.90
63.07
Nifty Spot = 7934.90
Lot Size = 75
Bull-Call Spreads
Bear-Put Spreads
Action
Strike
Price
Risk
Reward
BEP
Action
Strike
Price
Risk
Reward
BEP
Buy
7900
53.80
Buy
8000
66.05
45.15
54.85
7945.15
52.55
47.45
7947.45
Sell
8000
8.65
Sell
7900
13.50
Buy
7900
53.80
Buy
8000
66.05
53.00
147.00
7953.00
63.95
136.05
7936.05
Sell
8100
0.80
Sell
7800
2.10
Buy
8000
8.65
Buy
7900
13.50
7.85
92.15
8007.85
11.40
88.60
7888.60
Sell
8100
0.80
Sell
7800
2.10
Note: Above mentioned Bullish or Bearish Spreads in Nifty (May Series) are given as an information and not as a recommendation.
Nifty Put-Call Analysis
3
Technical & Derivatives Report
May 26, 2016
Daily Pivot Levels for Nifty Constituents
Scrips
S2
S1
PIVOT
R1
R2
ACC
1,436
1,455
1,472
1,492
1,509
ADANIPORTS
180
181
183
184
185
AMBUJACEM
214
218
221
225
228
ASIANPAINT
954
968
977
991
999
AUROPHARMA
714
728
736
751
759
AXISBANK
490
496
500
506
509
BAJAJ-AUTO
2,324
2,400
2,452
2,528
2,581
BANKBARODA
129
131
133
135
136
BHEL
117
120
122
124
126
BPCL
854
885
913
945
973
BHARTIARTL
345
348
350
354
356
INFRATEL
382
388
393
399
404
BOSCH
20,802
21,348
21,746
22,293
22,691
CIPLA
447
458
469
481
492
COALINDIA
276
279
280
282
284
DRREDDY
2,994
3,023
3,049
3,078
3,104
EICHERMOT
18,159
18,345
18,452
18,638
18,746
GAIL
369
375
380
386
391
GRASIM
4,270
4,307
4,331
4,368
4,392
HCLTECH
736
743
747
753
757
HDFCBANK
1,136
1,154
1,165
1,184
1,195
HDFC
1,170
1,189
1,201
1,219
1,231
HEROMOTOCO
2,889
2,908
2,924
2,943
2,959
HINDALCO
87
88
89
89
90
HINDUNILVR
822
831
836
845
851
ICICIBANK
223
229
232
238
241
IDEA
103
106
108
112
114
INDUSINDBK
1,040
1,068
1,083
1,112
1,127
INFY
1,186
1,197
1,205
1,216
1,224
ITC
347
351
354
359
362
KOTAKBANK
695
704
710
719
725
LT
1,233
1,262
1,280
1,310
1,328
LUPIN
1,452
1,462
1,479
1,489
1,505
M&M
1,292
1,302
1,310
1,320
1,328
MARUTI
3,892
3,977
4,024
4,109
4,156
NTPC
138
140
141
143
144
ONGC
207
209
210
211
212
POWERGRID
146
148
149
151
152
RELIANCE
937
944
948
956
960
SBIN
170
172
174
177
178
SUNPHARMA
763
774
782
793
801
TCS
2,462
2,494
2,513
2,546
2,565
TATAMTRDVR
261
266
269
273
276
TATAMOTORS
391
394
397
400
403
TATAPOWER
71
72
73
74
74
TATASTEEL
315
320
323
328
331
TECHM
481
505
518
542
556
ULTRACEMCO
3,170
3,190
3,201
3,221
3,232
WIPRO
536
541
544
549
552
YESBANK
979
988
993
1,002
1,008
ZEEL
435
439
443
447
452
4
Technical & Derivatives Report
May 26, 2016
Research Team Tel: 022 - 39357800
For Technical Queries
For Derivatives Queries
DISCLAIMER
Angel Broking Private Limited (hereinafter referred to as “Angel”) is a registered Member of National Stock Exchange of India Limited,
Bombay Stock Exchange Limited and MCX Stock Exchange Limited. It is also registered as a Depository Participant with CDSL and
Portfolio Manager with SEBI. It also has registration with AMFI as a Mutual Fund Distributor. Angel Broking Private Limited is a
registered entity with SEBI for Research Analyst in terms of SEBI (Research Analyst) Regulations, 2014 vide registration number
INH000000164. Angel or its associates has not been debarred/ suspended by SEBI or any other regulatory authority for accessing
/dealing in securities Market. Angel or its associates including its relatives/analyst do not hold any financial interest/beneficial
ownership of more than 1% in the company covered by Analyst. Angel or its associates/analyst has not received any compensation /
managed or co-managed public offering of securities of the company covered by Analyst during the past twelve months. Angel/analyst
has not served as an officer, director or employee of company covered by Analyst and has not been engaged in market making activity
of the company covered by Analyst.
This document is solely for the personal information of the recipient, and must not be singularly used as the basis of any investment
decision. Nothing in this document should be construed as investment or financial advice. Each recipient of this document should
make such investigations as they deem necessary to arrive at an independent evaluation of an investment in the securities of the
companies referred to in this document (including the merits and risks involved), and should consult their own advisors to determine
the merits and risks of such an investment.
Reports based on technical and derivative analysis center on studying charts of a stock's price movement, outstanding positions and
trading volume, as opposed to focusing on a company's fundamentals and, as such, may not match with a report on a company's
fundamentals.
The information in this document has been printed on the basis of publicly available information, internal data and other reliable
sources believed to be true, but we do not represent that it is accurate or complete and it should not be relied on as such, as this
document is for general guidance only. Angel Broking Pvt. Limited or any of its affiliates/ group companies shall not be in any way
responsible for any loss or damage that may arise to any person from any inadvertent error in the information contained in this report.
Angel Broking Pvt. Limited has not independently verified all the information contained within this document. Accordingly, we cannot
testify, nor make any representation or warranty, express or implied, to the accuracy, contents or data contained within this document.
While Angel Broking Pvt. Limited endeavors to update on a reasonable basis the information discussed in this material, there may be
regulatory, compliance, or other reasons that prevent us from doing so.
This document is being supplied to you solely for your information, and its contents, information or data may not be reproduced,
redistributed or passed on, directly or indirectly.
Neither Angel Broking Pvt. Limited, nor its directors, employees or affiliates shall be liable for any loss or damage that may arise from
or in connection with the use of this information.
Note: Please refer to the important ‘Stock Holding Disclosure' report on the Angel website (Research Section). Also, please refer to the
latest update on respective stocks for the disclosure status in respect of those stocks. Angel Broking Pvt. Limited and its affiliates may
have investment positions in the stocks recommended in this report.
5