Technical & Derivatives Report
November 16, 2017
Sensex (32760) / Nifty (10118)
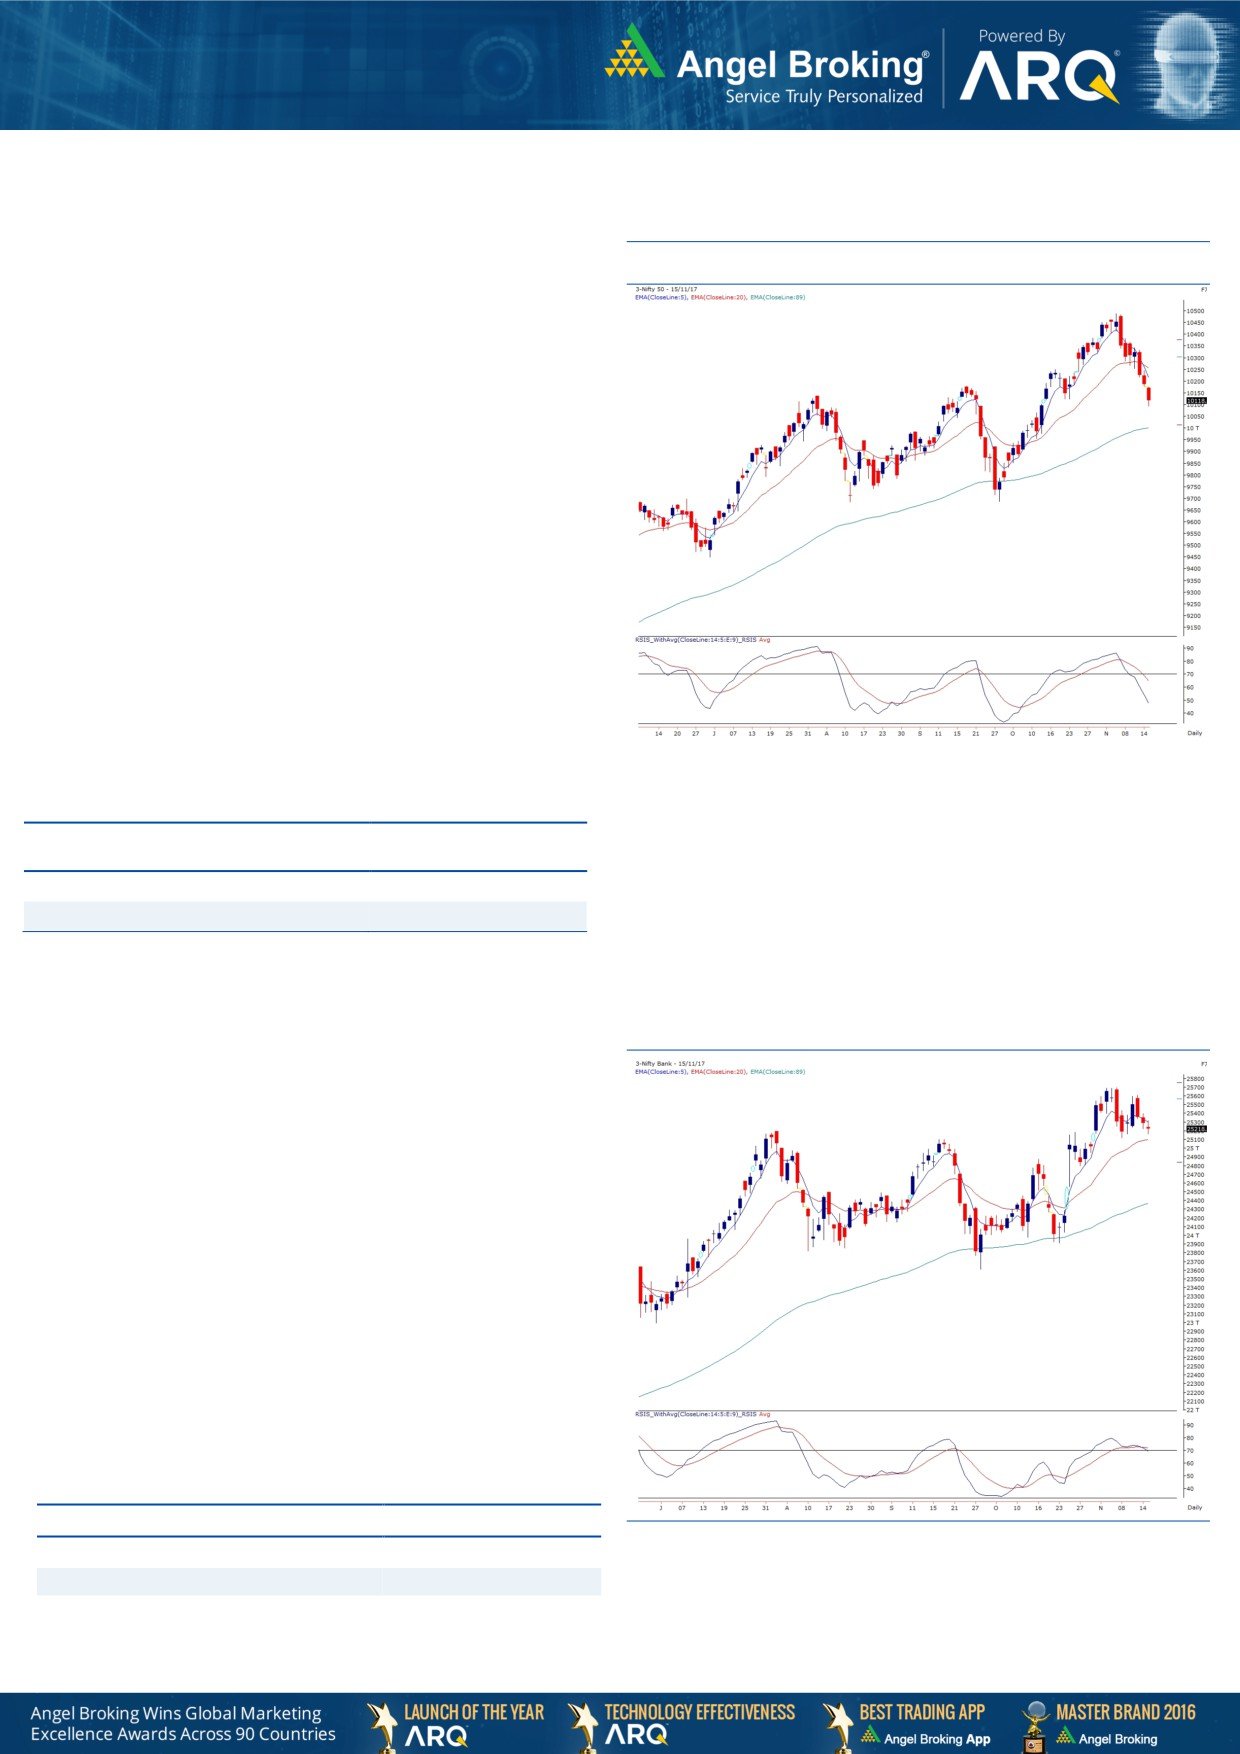
Exhibit 1: Nifty Daily Chart
Yesterday, our markets kick started with a downside gap
taking cues from the Asian bourses. There was no respite for
the third straight session as we saw Nifty sneaking below the
10100 mark. Undoubtedly, the entire ADAG pack was the
biggest culprit in spoiling traders’ sentiments yesterday. All
stocks from this group kept falling like a pack of cards.
As far as index is concerned, we would continue with our
latest stance and after anticipating sub-10200 levels, we are
now heading towards the next junction of 10000 (daily 89
EMA). With reference to previous articles, multiple technical
evidences like, the ‘5&20 EMA’ crossover and falling ‘RSI-
Smoothened’ are providing conviction to our stance. In
addition to this, yesterday we saw a decisive breach of
previous breakout points placed around
10180, which
certainly does not bode well for the bulls. The resistance zone
has now shifted lower towards 10175 and 10223. One needs
to be very watchful while picking up a stock specific trade.
Key Levels
Support 1 - 10067
Resistance 1 - 10175
Support 2 - 10000
Resistance 2 - 10223
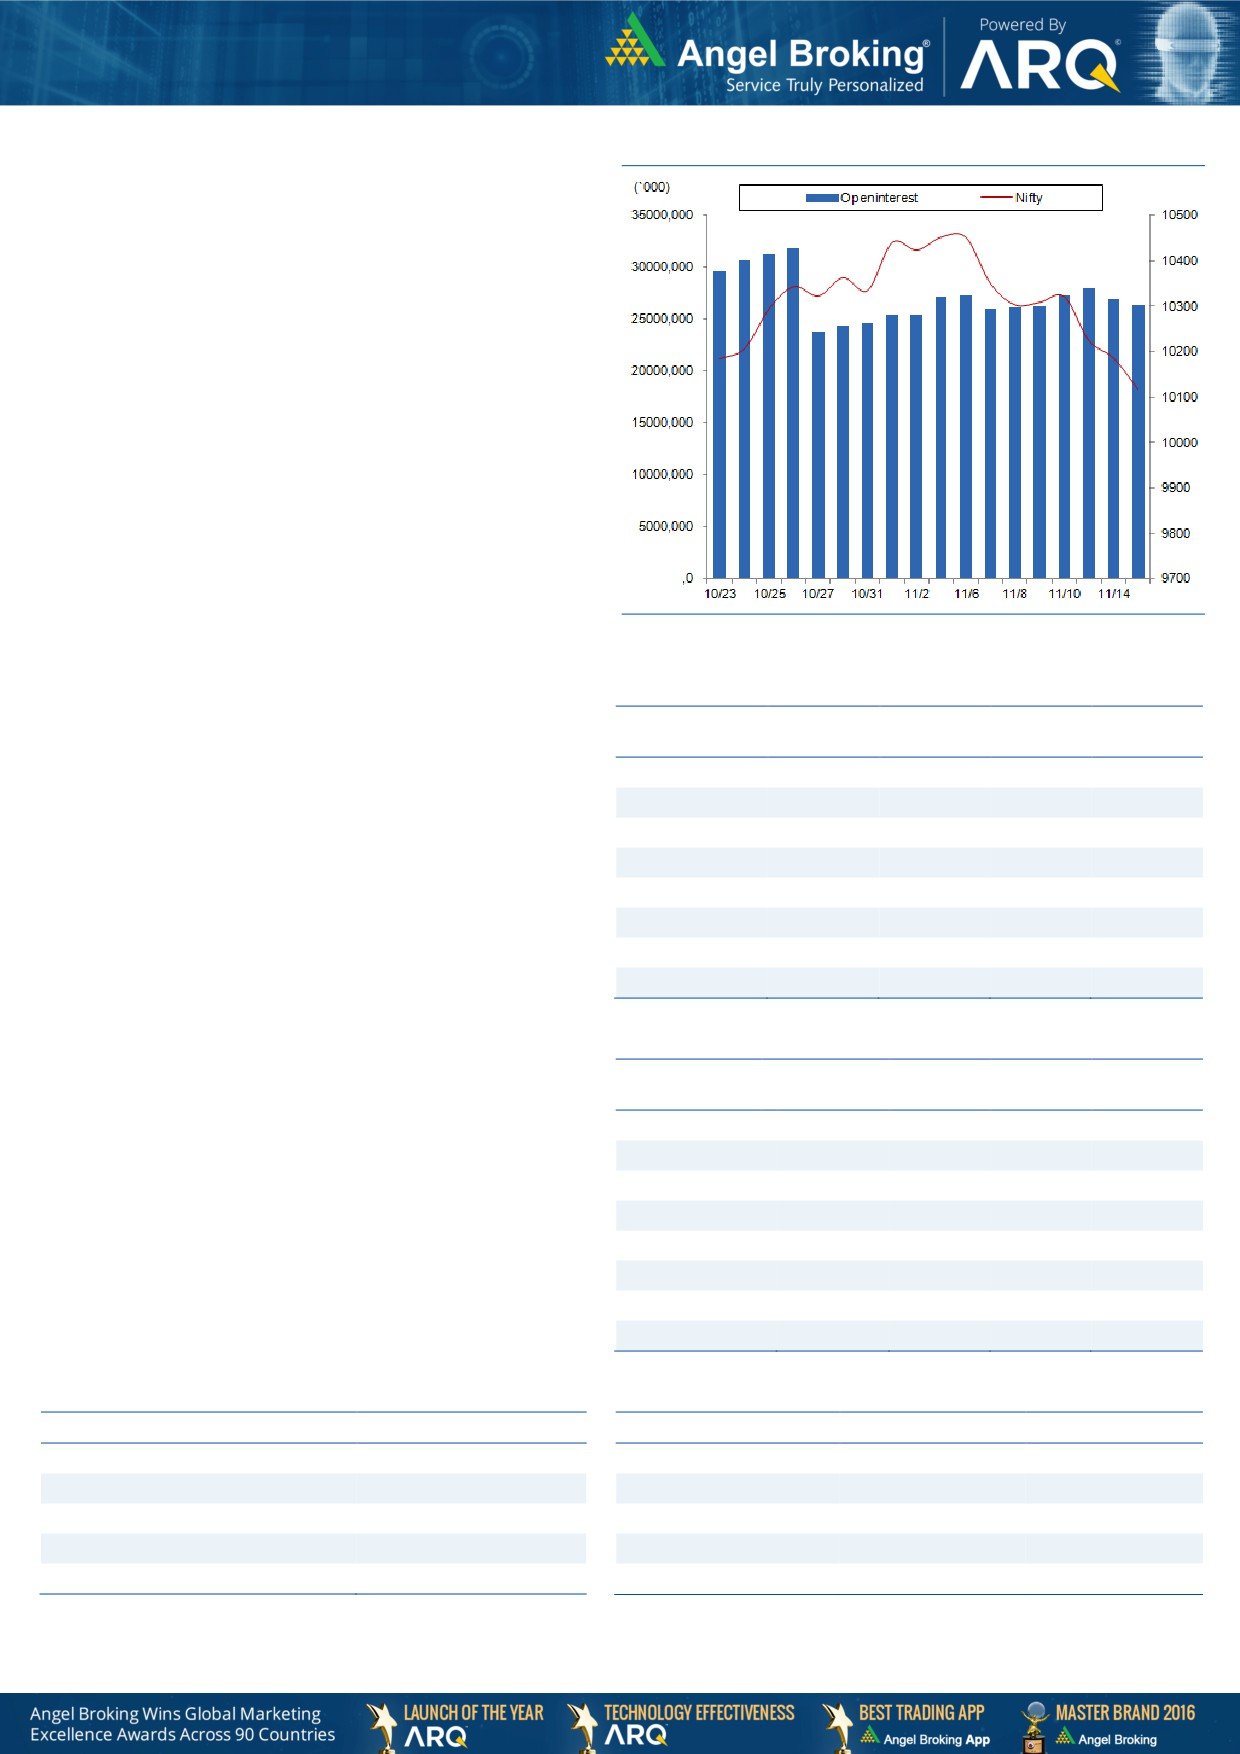
Nifty Bank Outlook - (25219)
Exhibit 2: Nifty Bank Daily Chart
The Nifty Bank index continues its consolidation phase as
expected and traded in a narrow range of about 150 points in
yesterday's session.
In spite of a sell-off in the broader markets, the Nifty Bank
index traded in a range and comparatively outperformed the
benchmark indices. The private sector banks, which constitute
majority of the index weightage, showed relative strength
which prevented the index from any significant correction.
However, broadly the index is in a consolidation phase, much
in line with we have expecting since last few days. Hence, we
continue with our advice to traders to focus on stock specific
moves from the banking space and avoid taking any
directional bet on the index.
Key Levels
Support 1 - 25113
Resistance 1 - 25400
Support 2 - 25050
Resistance 2 - 25450
Technical & Derivatives Report
November 16, 2017
Comments
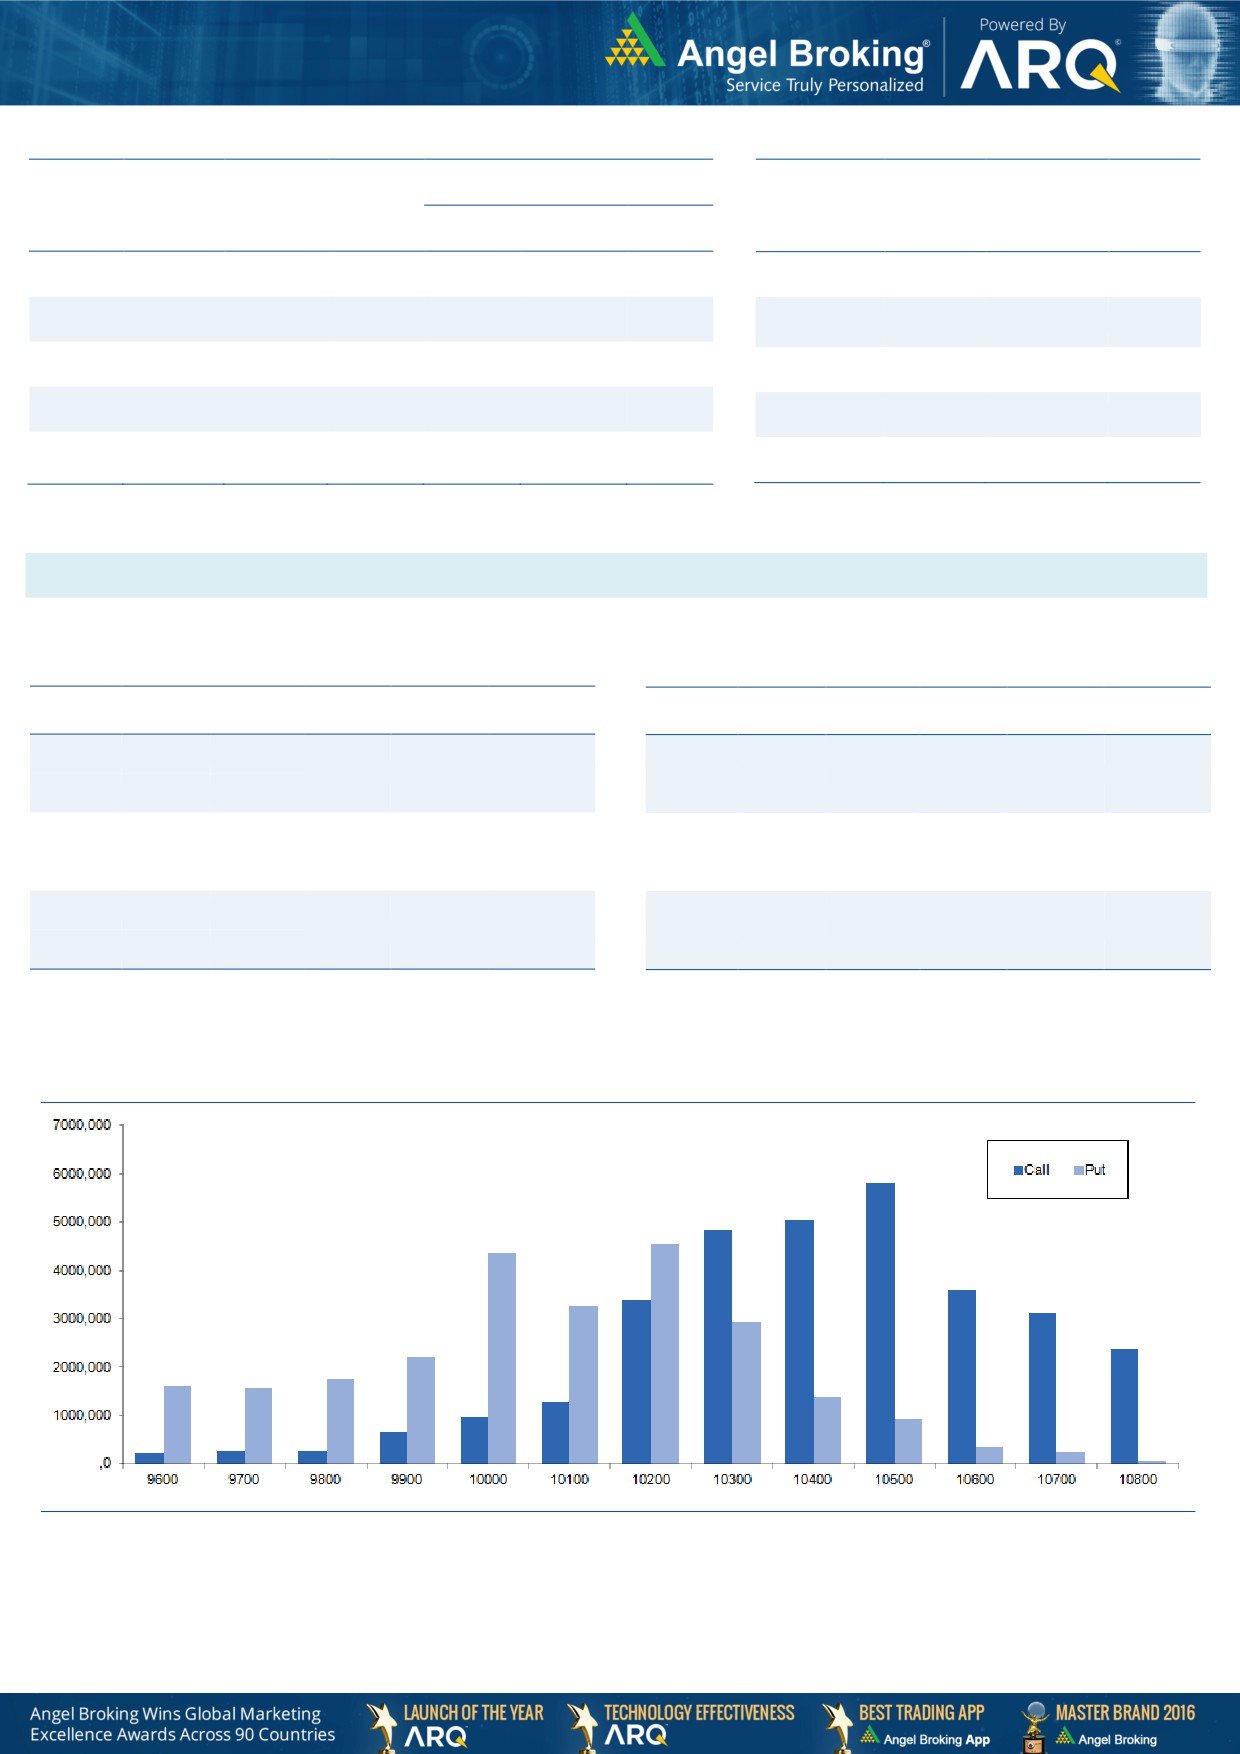
Nifty Vs OI
The Nifty futures open interest has decreased by 2.13%
BankNifty futures open interest has decreased by 1.18%
as market closed at 10118.05 levels.
The Nifty November future closed with a premium of
36.30 points against a premium of 47 points in last
trading session. The December series closed at a
premium of 73.25 points.
The INDIA VIX has increased from 14.16 to 14.26. At the
same time, the PCR-OI of Nifty has decreased from 1.19
to 1.13 level.
Few of the liquid counters where we have seen high cost
of carry are TV18BRDCST, HDIL, IDBI, ALBK and MRPL.
Views
FIIs were net sellers in both cash market segment and
OI Gainers
index futures. They sold equities to the tune of Rs. 381
OI
PRICE
crores. While, they were sellers of Rs. 1325 crores in
SCRIP
OI
PRICE
CHG. (%)
CHG. (%)
index futures with some fall in open interest, suggesting
JETAIRWAYS
7833600
16.76
693.40
0.06
blend of long unwinding and fresh short formation in
BALKRISIND
420000
11.35
2162.30
3.74
yesterday's trading session.
ICIL
12393500
10.59
121.30
7.44
In index options front, they sold worth Rs. 821 crores with
BATAINDIA
2497000
10.09
747.00
-5.04
rise in open interest. In call options, fresh build-up was
IGL
5769500
8.37
305.60
-3.09
seen in 10100-10200 strikes. On the other side, we
VGUARD
3099000
7.83
225.05
-2.41
some open interest addition
10100 and
9800 put
RELCAPITAL
14563500
7.72
423.85
-10.44
options; followed by good amount of unwinding in
RECLTD
40368000
7.25
155.45
-3.30
10300 strike. At present, highest open interest remains
intact at 10500 call and 10200 put options.
Yesterday's market extended its loss for the third
OI Losers
OI
PRICE
consecutive session. Since past couple of days, FIIs have
SCRIP
OI
PRICE
CHG. (%)
CHG. (%)
been forming good amount of short positions in index
VOLTAS
2564000
-16.43
586.55
-2.18
futures and they also unwound some of their existing
BANKBARODA
51700500
-15.46
175.25
-0.03
longs. At the same time, they also formed long positions
HEXAWARE
2556000
-11.25
336.75
-2.11
in index put options along with writing in call strikes.
CEATLTD
2037700
-9.39
1756.35
2.00
Considering the above data points, we believe market
JUSTDIAL
2949800
-8.18
507.35
-6.44
may witness further pain in near term. Thus, any bounce
KSCL
4524000
-7.26
516.00
-3.08
back shall be an opportunity to buy puts of current series.
RAMCOCEM
628800
-6.21
703.45
1.90
CGPOWER
28212000
-5.43
79.70
-3.04
Historical Volatility
Put-Call Ratio
SCRIP
HV
SCRIP
PCR-OI
PCR-VOL
RPOWER
50.88
NIFTY
1.13
0.81
RELINFRA
58.40
BANKNIFTY
0.94
0.67
RNAVAL
55.11
TATAMOTORS
0.33
0.36
FORTIS
46.39
RELIANCE
0.40
0.48
RELCAPITAL
74.69
YESBANK
0.34
0.42
Technical & Derivatives Report
November 16, 2017
FII Statistics for November 15, 2017
Turnover on November 15, 2017
Open Interest
No. of
Turnover
Change
Detail
Buy
Sell
Net
Instrument
Value
Change
Contracts
( in Cr. )
(%)
Contracts
(in Cr.)
(%)
INDEX
INDEX
1986.46
3311.04
(1324.58)
335434
26185.28
(2.83)
199417
16944.72
12.22
FUTURES
FUTURES
INDEX
INDEX
64554.02
65375.06
(821.04)
1105069
86509.74
2.75
6348353
589581.29
45.40
OPTIONS
OPTIONS
STOCK
8369.56
8961.57
(592.00)
1018451
69214.74
0.31
STOCK
FUTURES
758016
50945.38
11.98
FUTURES
STOCK
STOCK
7610.13
7710.20
(100.07)
121694
8399.16
1.33
562872
39149.79
18.80
OPTIONS
OPTIONS
Total
82520.18
85357.87
(2837.69)
2580648
190308.92
0.96
TOTAL
7868658
696621.18
39.60
Nifty Spot = 10118.05
Lot Size = 75
Bull-Call Spreads
Bear-Put Spreads
Action
Strike
Price
Risk
Reward
BEP
Action
Strike
Price
Risk
Reward
BEP
Buy
10100
127.90
Buy
10100
74.30
53.60
46.40
10153.60
28.25
71.75
10071.75
Sell
10200
74.30
Sell
10000
46.05
Buy
10100
127.90
Buy
10100
74.30
88.40
111.60
10188.40
46.75
153.25
10053.25
Sell
10300
39.50
Sell
9900
27.55
Buy
10200
74.30
Buy
10000
46.05
34.80
65.20
10234.80
18.50
81.50
9981.50
Sell
10300
39.50
Sell
9900
27.55
Note: Above mentioned Bullish or Bearish Spreads in Nifty (November Series) are given as an information and not as a recommendation.
Nifty Put-Call Analysis
Technical & Derivatives Report
November 16, 2017
Daily Pivot Levels for Nifty Constituents
Scrips
S2
S1
PIVOT
R1
R2
ADANIPORTS
398
402
408
413
419
AMBUJACEM
268
272
275
279
282
ASIANPAINT
1,135
1,158
1,174
1,197
1,213
AUROPHARMA
676
686
699
709
722
AXISBANK
529
536
544
550
558
BAJAJ-AUTO
3,159
3,186
3,234
3,261
3,309
BAJFINANCE
1,671
1,693
1,728
1,749
1,785
BPCL
489
497
503
511
517
BHARTIARTL
474
481
490
496
505
INFRATEL
360
369
384
393
408
BOSCHLTD
18,816
19,011
19,355
19,550
19,895
CIPLA
580
587
597
604
615
COALINDIA
268
270
272
274
276
DRREDDY
2,269
2,290
2,313
2,334
2,357
EICHERMOT
29,704
30,094
30,390
30,780
31,076
GAIL
428
439
451
462
474
HCLTECH
826
837
857
868
888
HDFCBANK
1,782
1,791
1,797
1,807
1,813
HDFC
1,631
1,641
1,659
1,669
1,687
HEROMOTOCO
3,604
3,638
3,674
3,707
3,743
HINDALCO
242
247
253
258
265
HINDPETRO
405
409
416
421
427
HINDUNILVR
1,243
1,254
1,270
1,280
1,296
IBULHSGFIN
1,112
1,137
1,173
1,198
1,234
ICICIBANK
309
312
316
319
323
IOC
384
387
391
394
398
INDUSINDBK
1,563
1,580
1,610
1,628
1,658
INFY
941
946
950
955
959
ITC
247
250
254
257
261
KOTAKBANK
991
1,001
1,008
1,018
1,024
LT
1,195
1,202
1,214
1,221
1,232
LUPIN
810
817
826
833
841
M&M
1,395
1,405
1,417
1,427
1,439
MARUTI
8,038
8,083
8,131
8,176
8,224
NTPC
172
173
175
176
178
ONGC
173
175
178
181
184
POWERGRID
203
205
206
208
209
RELIANCE
871
878
884
890
897
SBIN
317
321
326
330
335
SUNPHARMA
490
497
509
516
527
TCS
2,667
2,686
2,721
2,740
2,774
TATAMOTORS
401
405
411
415
422
TATASTEEL
664
671
676
683
688
TECHM
479
488
494
502
508
ULTRACEMCO
4,214
4,260
4,308
4,354
4,402
UPL
698
710
728
740
758
VEDANTA
286
291
299
303
311
WIPRO
291
294
297
299
302
YESBANK
291
296
301
306
311
ZEEL
534
537
540
543
546
Technical & Derivatives Report
November 16, 2017
Research Team Tel: 022 - 39357800
For Technical Queries
For Derivatives Queries
DISCLAIMER
Angel Broking Private Limited (hereinafter referred to as “Angel”) is a registered Member of National Stock Exchange of India Limited,
Bombay Stock Exchange Limited and Metropolitan Stock Exchange Limited. It is also registered as a Depository Participant with CDSL
and Portfolio Manager and Investment Adviser with SEBI. It also has registration with AMFI as a Mutual Fund Distributor. Angel Broking
Private Limited is a registered entity with SEBI for Research Analyst in terms of SEBI (Research Analyst) Regulations, 2014 vide
registration number INH000000164. Angel or its associates has not been debarred/ suspended by SEBI or any other regulatory
authority for accessing /dealing in securities Market. Angel or its associates/analyst has not received any compensation / managed or
co-managed public offering of securities of the c*ompany covered by Analyst during the past twelve months.
This document is solely for the personal information of the recipient, and must not be singularly used as the basis of any investment
decision. Nothing in this document should be construed as investment or financial advice. Each recipient of this document should
make such investigations as they deem necessary to arrive at an independent evaluation of an investment in the securities of the
companies referred to in this document (including the merits and risks involved), and should consult their own advisors to determine
the merits and risks of such an investment.
Reports based on technical and derivative analysis center on studying charts of a stock's price movement, outstanding positions and
trading volume, as opposed to focusing on a company's fundamentals and, as such, may not match with a report on a company's
fundamentals. Investors are advised to refer the Fundamental and Technical Research Reports available on our website to evaluate the
contrary view, if any.
The information in this document has been printed on the basis of publicly available information, internal data and other reliable
sources believed to be true, but we do not represent that it is accurate or complete and it should not be relied on as such, as this
document is for general guidance only. Angel Broking Pvt. Limited or any of its affiliates/ group companies shall not be in any way
responsible for any loss or damage that may arise to any person from any inadvertent error in the information contained in this report.
Angel Broking Pvt. Limited has not independently verified all the information contained within this document. Accordingly, we cannot
testify, nor make any representation or warranty, express or implied, to the accuracy, contents or data contained within this document.
While Angel Broking Pvt. Limited endeavors to update on a reasonable basis the information discussed in this material, there may be
regulatory, compliance, or other reasons that prevent us from doing so.
This document is being supplied to you solely for your information, and its contents, information or data may not be reproduced,
redistributed or passed on, directly or indirectly.
Neither Angel Broking Pvt. Limited, nor its directors, employees or affiliates shall be liable for any loss or damage that may arise from
or in connection with the use of this information.