Aug 24, 2022
www.angelone.in
Technical & Derivatives Report
OOOOOOOO
Nifty Bank Outlook (38698)
Similar to the previous session, Bank Nifty started with a huge gap
down opening however right from the start there was buying
momentum that not only erased the morning lost ground but entered
well into positive territory. The action was however not done yet as
we witnessed wild swings on both sides after that and with bulls
having the upper hand the bank index eventually ended the volatile
session with gains of a percent tad below 38700 levels.
In our yesterday's outlook, we had clearly stated the last two session's
weaknesses as just a price correction and that the undertone remains
bullish. This point was clearly validated as twice there was strong
buying seen yesterday at the lower levels. Now we are witnessing a
strong bullish candle on the daily chart that is seen on the key support
of 20EMA and hence we sense that any dips in the near term are likely
to get bought and yesterday's low around 38000 to act as sacrosanct
support. On the higher side, immediate resistance is seen around
39070 and 39300 levels. Even though the momentum is back with the
bulls, one should avoid getting complacent and need to be very
selective as global markets remain highly volatile.
Key Levels
Support 1 – 38150 Resistance 1 – 39070
Support 2 – 38000 Resistance 2 – 39300
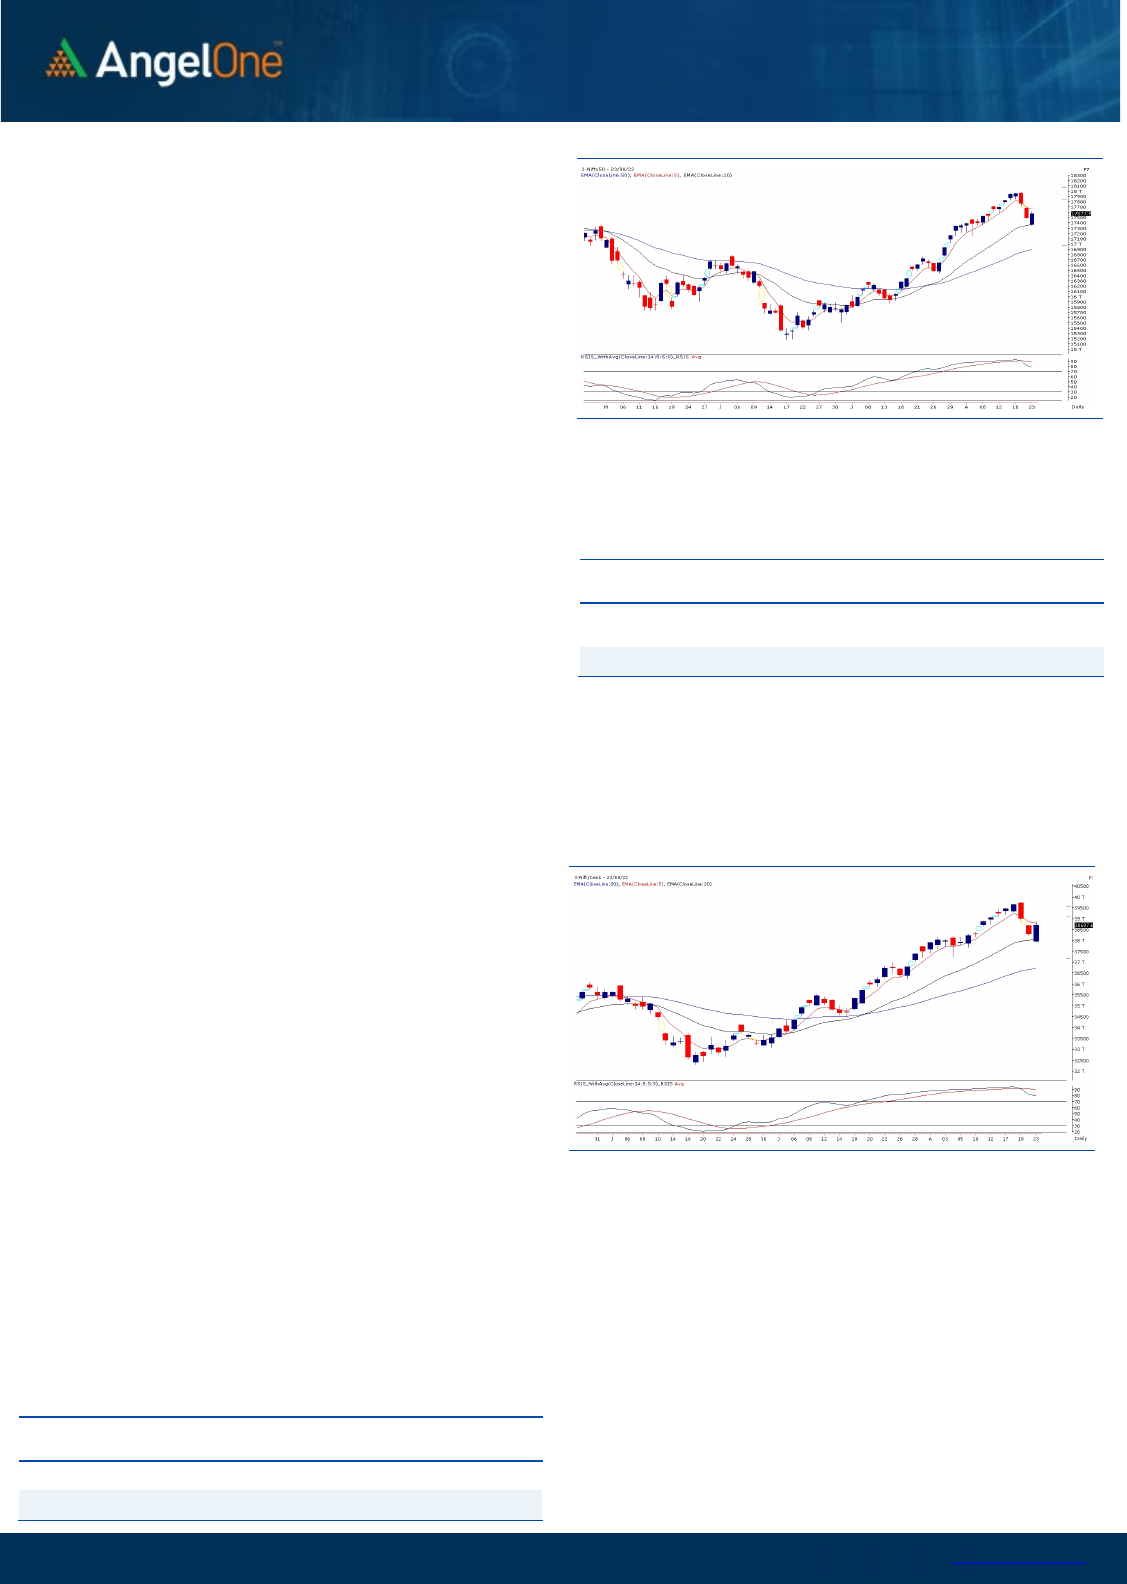
Exhibit 1: Nifty
Daily
Chart
Exhibit 2: Nifty Bank Daily Chart
Sensex (59031) / Nifty (17557)
Monday night, US markets had one more round of selling which
dampened the overall sentiments of traders across the globe. Tracking
these cues, our markets too started off lower to hasten towards the key
support of 17350. This being the ’20-day EMA’ level, the correction
halted in the opening hour which was then followed by a sharp
recovery to not only erase all losses but also entered the positive
terrain. The similar sort of swings on either sides repeated during the
latter half as well. Eventually, the action packed session eventually
ended with half a percent gains tad above the 17550 mark.
The Nifty has completed a price correction of 650 points in merely three
sessions i.e. nearly 3.50% from the Friday’s high of 17992.20. In our
previous commentary, we had mentioned about the support zone
around 17400 – 17350. Since it coincided with the key moving average
(20-EMA), the oversold market attracted some buying at lower levels.
With the help of RIL and banking space who became the real
protagonists, the benchmark index Nifty managed to close almost at
day’s high. Although, the rebound was very much on expected lines,
one should avoid getting carried away with this. We are still not out of
the woods yet till the time few important levels are taken out in the
upward direction. As of now, 17650 – 17710 is to be seen as immediate
resistance zone and momentum traders should ideally look to lighten
up longs around it. On the flipside, 17525 – 17450 are to be seen as
immediate supports.
The coming session can slightly be a tricky one, because if we
rebound first towards the mentioned intraday hurdles, the index is
likely to land up in corridor of uncertainty. Hence, it’s better to
follow one step at a time for couple of trading sessions.
Key Levels
Support 1 – 17525 Resistance 1 – 17650
Support 2 – 17450 Resistance 2 – 17710
www.angelone.in
Technical & Derivatives Report
Aug 24, 2022
View
Our market started the day on a sluggish note
tracking the weak global cues, wherein the
benchmark index tested the 20-DEMA. However, a
modest recovery was seen from the lows, and the
action-packed session eventually ended with half a
percent gains tad above the 17550 level.
FIIs were net buyers in the cash market segment to
the tune of Rs. 563 crores. Simultaneously, in Index
futures, they sold worth Rs. 110 crores with an increase
in open interest, indicating some short formation.
In the F&O space, we have seen mixed positions in both
the indices, with short covering in the Bank Nifty and
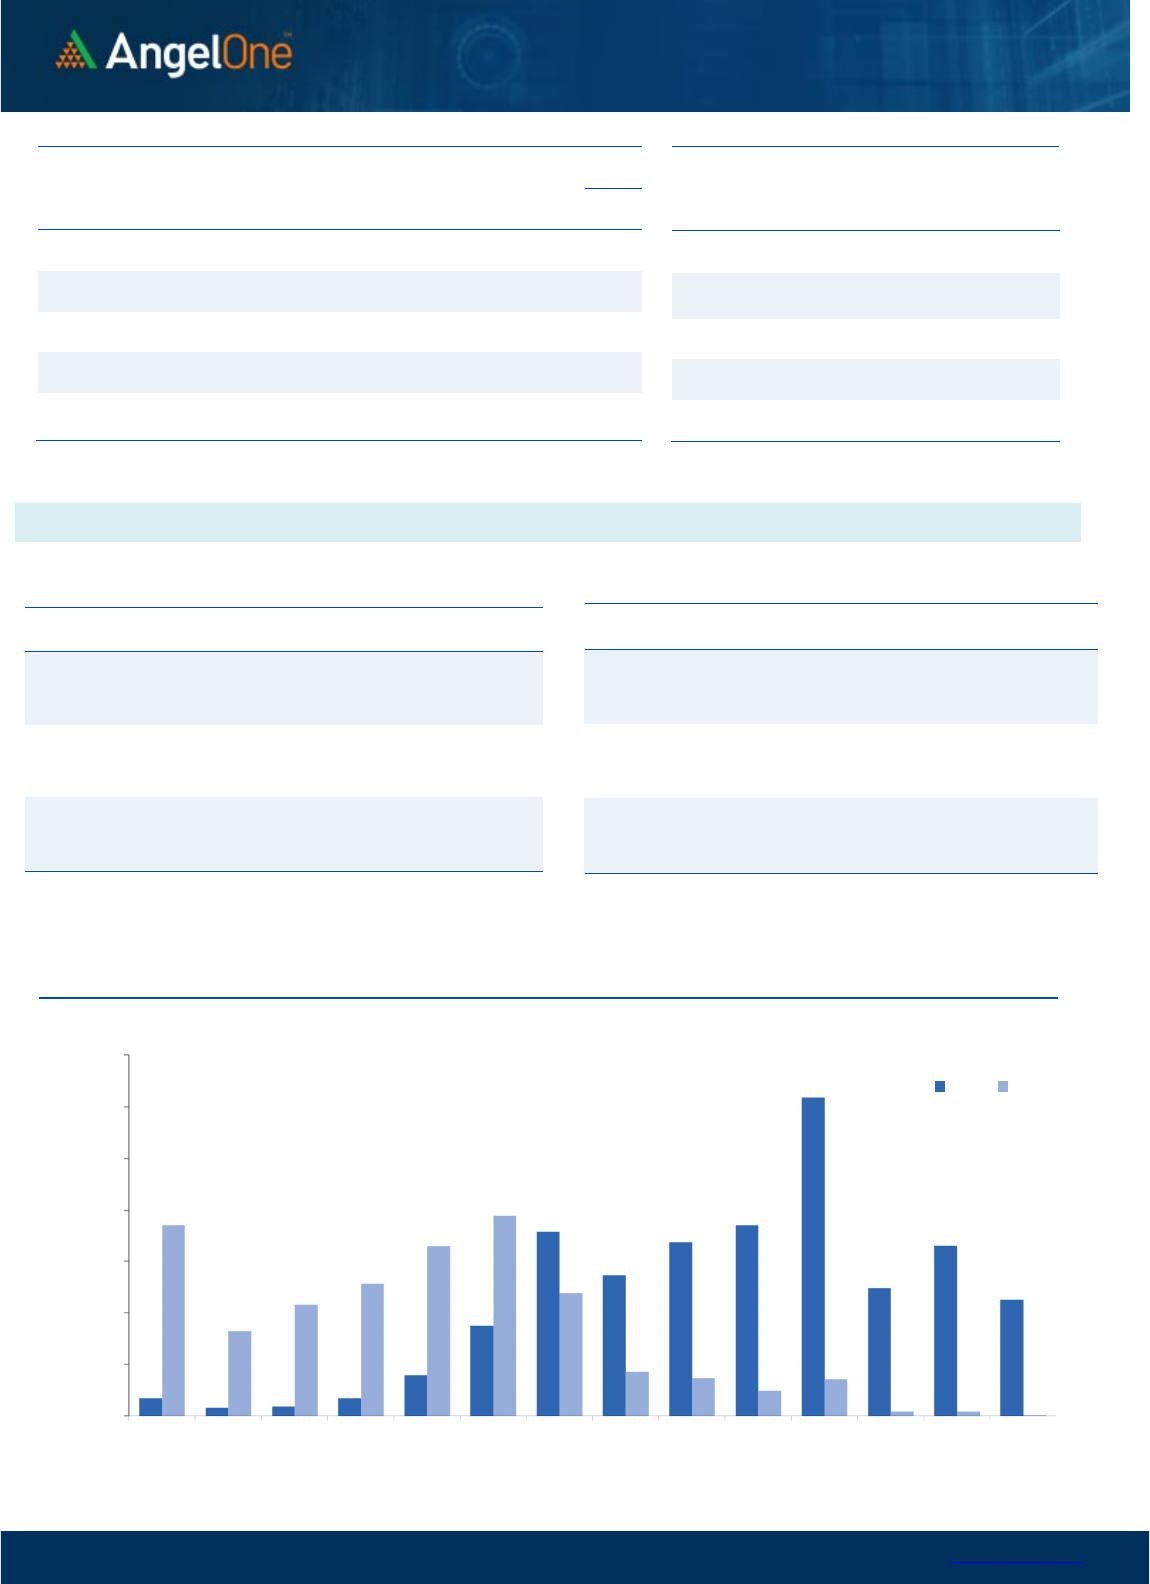
long formation in Nifty. On the options front, the
primary concentration of OI is seen at the 17500 put
strike, which is likely to act as an immediate support
zone. On the contrary, OI concentration could be seen
at 17700-17800 call strikes, which is likely to act as a
primary hurdle. Considering the recent price action, it
is advisable to keep a close tab on the mentioned
levels along with the global developments. Also, ahead
of the contract expiry, some volatility could be seen;
hence one should avoid aggressive overnight bets in
the indices.
Comments
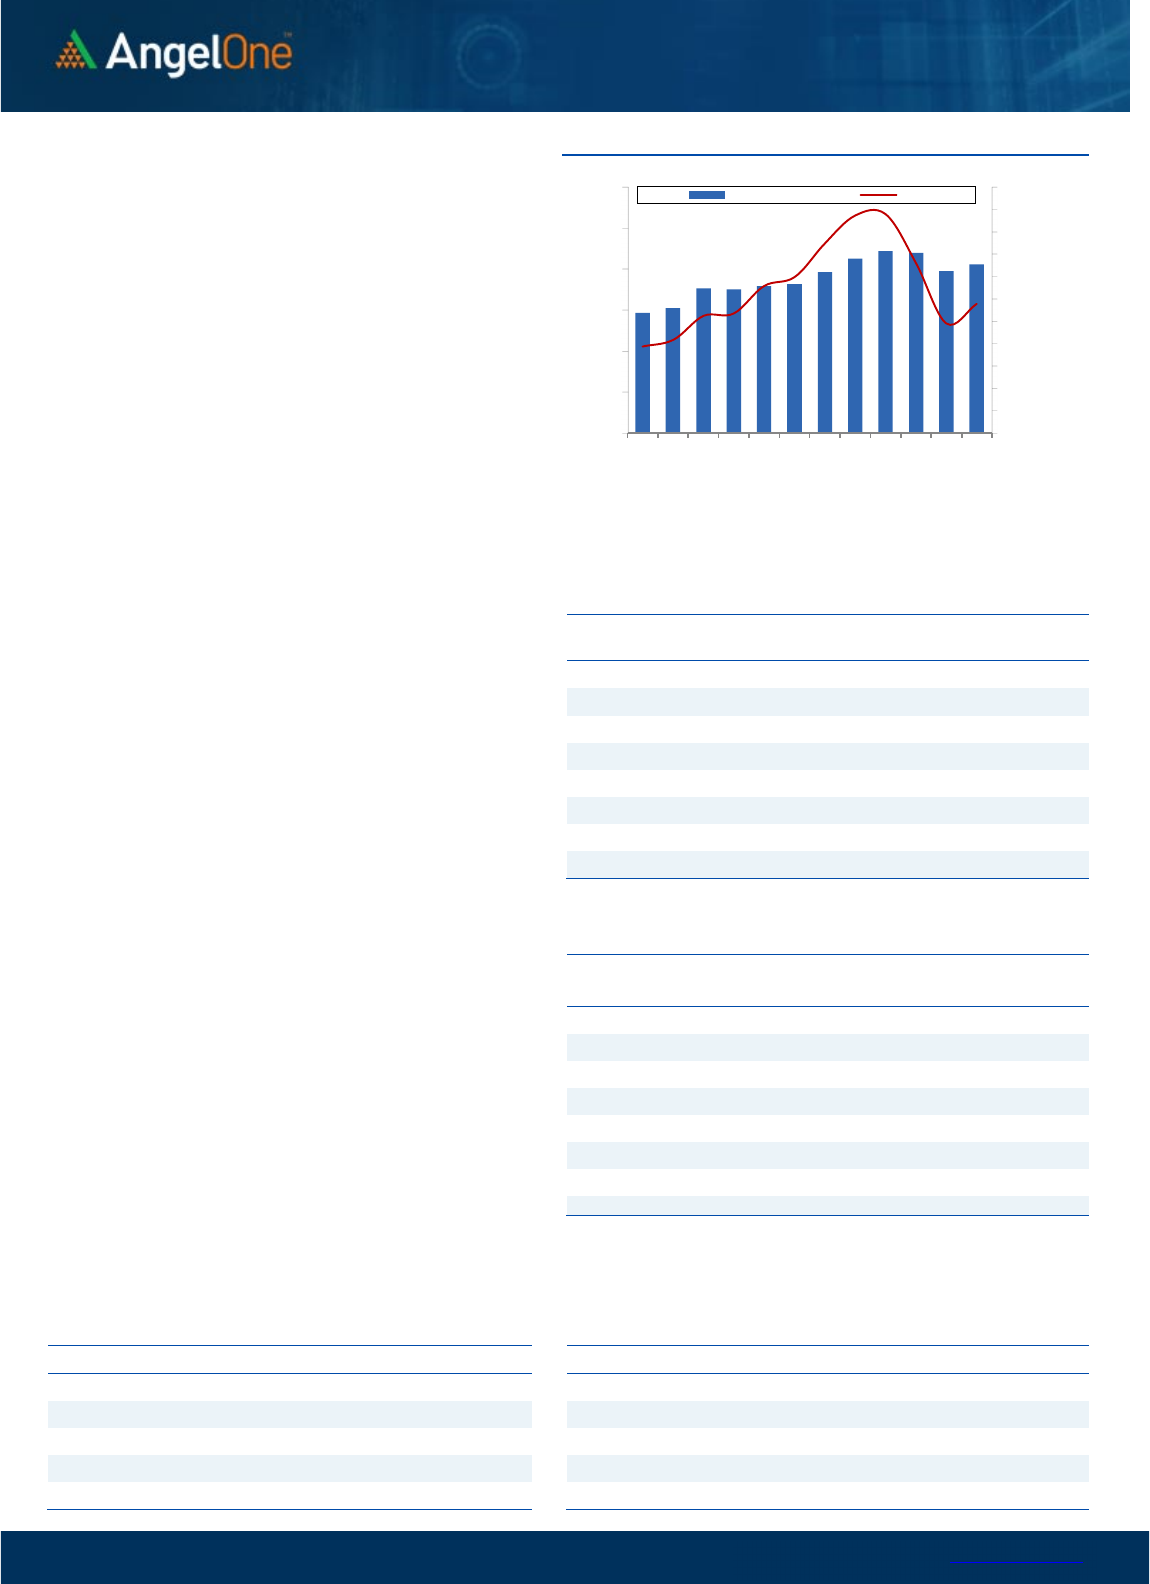
The Nifty futures open interest has increased by
2.43%. and Bank Nifty futures open interest has
decreased by 0.89% as the market closed at 17577.50.
The Nifty Aug future closed with a premium of 8.05
point against a premium of 1.55 point in the last
trading session. The Sep series closed at a premium
of 88.05 point.
The INDIA VIX increased from 19.03 to 19.05. At the
same time, the PCR-OI of Nifty has increased from
0.79 to 0.98.
Few of the liquid counters where we have seen high
cost of carry are NMDC, IDFCFRSTB, COROMANDEL,
M&M and CUB.
Historical
Volatility
SCRIP HV
IDEA 83.50
IBULHSGFIN 74.87
RBLBANK 71.71
ZEEL 65.22
HINDCOPPER 64.94
Nifty Vs OI
17000
17100
17200
17300
17400
17500
17600
17700
17800
17900
18000
18100
6,000
8,000
10,000
12,000
14,000
16,000
18,000
8/4 8/8 8/11 8/16 8/18 8/22
Openinterest Nifty
OI Gainers
SCRIP OI
OI
CHG. (%)
PRICE
PRICE
CHG. (%)
CUB 7985000 28.89 178.90 3.78
ATUL 149700 26.49 9239.20 3.35
DIXON 844375 15.16 4049.55 0.41
DELTACORP 18002100 15.12 209.35 3.52
BEL 27455000 11.89 298.45 3.20
INDIACEM 12678800 11.79 206.80 3.43
UBL 1271600 11.04 1622.70 -1.23
IDFC 130480000 10.86 61.25 3.11
OI Losers
SCRIP OI
OI
CHG. (%)
PRICE
PRICE
CHG. (%)
SYNGENE 2512000 -16.32 595.55 2.41
VOLTAS 3525000 -15.86 994.50 1.97
TATACHEM 5852000 -15.82 1101.25 1.48
POLYCAB 882300 -11.84 2399.70 2.13
INDUSTOWER 21394800 -11.83 199.10 2.09
IPCALAB 1614600 -10.94 922.65 2.13
ASHOKLEY 46060000 -9.42 146.65 3.24
GUJGASLTD 5283750 -9.29 488.50 2.03
Put-Call Ratio
SCRIP PCR (OI) PCR (VOL)
NIFTY 0.98 0.90
BANKNIFTY 0.88 0.91
RELIANCE 0.56 0.55
ICICIBANK 0.82 0.60
INFY 0.43 0.63
www.angelone.in
Technical & Derivatives Report
Aug 24, 2022
Note: Above mentioned Bullish or Bearish Spreads in Nifty (Aug Series) are given as an information and not as a recommendation.
Nifty Spot =
17,
5
5
7
.
5
0
FII Statistics for
August
2
3
, 2022
Detail Buy
Contracts
Open
Interest
Value
(in Cr.)
Sell
Net
CHANGE
INDEX
FUTURES
5566.14 5676.59 (110.45) 175985 15935.55 0.50
INDEX
OPTIONS
900094.14 894025.84 6068.30
1667374 150473.68
9.26
STOCK
FUTURES
55409.10 55041.84 367.26
2159891 150034.98
(0.17)
STOCK
OPTIONS
11108.74 10924.14 184.60
162796 11562.20
(8.06)
Total 972178.12
965668.41
6509.71
4166046
328006.41
3.07
Turnover on
August
2
3
, 2022
Instrument
No. of
Contracts
Turnover
( in Cr. )
Change
(%)
Index
Futures
623745 56729.98 33.73
Index Options
149467779
13574265.72 56.77
Stock
Futures
2372753 165967.25 7.57
Stock Options
4928592 379334.77 -0.19
Total
49,28,592
379334.77 53.50
Bull-Call Spreads
Action Strike Price Risk Reward BEP
Buy
17500 131.70
53.80
46.20
17553.80
Sell
17600 77.90
Buy
17500 131.70
91.50
108.50
17591.50
Sell
17700 40.20
Buy
17600 77.90
37.70 62.30 17637.70
Sell 17700 40.20
Bear
-
Put Spreads
Action Strike Price Risk Reward BEP
Buy 17500 50.20
24.95
75.05
17475.05
Sell
17400 25.25
Buy 17500 50.20
36.35
163.65
17463.65
Sell 17300 13.85
Buy
17400 25.25
11.40 88.60 17388.60
Sell 17300 13.85
Nifty Put
-
Call Analysis
,0
2000,000
4000,000
6000,000
8000,000
10000,000
12000,000
14000,000
17000 17100 17200 17300 17400 17500 17600 17700 17800 17900 18000 18100 18200 18300
Call Put

www.angelone.in
Technical & Derivatives Report
Aug 24, 2022
`
Daily Pivot Levels for Nifty Constituents
Scrips
S2
S1
PIVOT
R1 R2
ADANIPORTS 781 807
832
858
883
APOLLOHOSP 3,945 4,008
4,051
4,114
4,156
ASIANPAINT 3,285 3,321
3,352 3,388
3,420
AXISBANK 727 737
744
754
761
BAJAJ-AUTO 3,994 4,029
4,051
4,086
4,108
BAJFINANCE
6,969
7,088
7,169
7,288
7,369
BAJAJFINSV 15,317 15,810
16,165
16,659
17,014
BPCL 329 331
333
336
337
BHARTIARTL 714 726
734
746
754
BRITANNIA
3,607
3,643
3,674 3,710
3,741
CIPLA 996 1,018
1,033
1,055
1,069
COALINDIA 214 218
221
226
228
DIVISLAB
3,491
3,512
3,550 3,571 3,609
DRREDDY 4,112 4,168
4,202 4,259 4,292
EICHERMOT 3,286 3,375
3,428 3,517
3,569
GRASIM
1,523
1,559
1,583
1,620
1,644
HCLTECH
934
940
946
952
958
HDFCBANK
1,439
1,452
1,464
1,478
1,490
HDFCLIFE
554
560
566
571
577
HDFC
2,375
2,398
2,420 2,442
2,464
HEROMOTOCO
2,736
2,770
2,790
2,824
2,844
HINDALCO
407
417
425
435
442
HINDUNILVR 2,558 2,575
2,603
2,620
2,647
ICICIBANK
833
848
858
874
883
INDUSINDBK 1,017 1,044
1,061 1,089
1,106
INFY
1,522
1,532
1,543
1,554
1,565
ITC
311
313
315
317
319
JSW STEEL
630
641
648
660
666
KOTAKBANK
1,799
1,828
1,848
1,877
1,897
LT
1,839
1,858
1,885
1,904
1,931
M&M 1,197 1,235
1,256
1,294
1,315
MARUTI 8,488 8,604
8,681
8,797
8,874
NESTLEIND
19,084
19,355
19,522
19,793
19,960
NTPC 154 156
158
160
161
ONGC
129
131
133
135
137
POWERGRID 222 225
227
230
232
RELIANCE
2,569
2,608
2,630
2,670
2,692
SBILIFE
1,258
1,269
1,281
1,291
1,303
SHREECEM
20,501
20,814
21,055
21,367
21,608
SBIN
502
512
518 528
534
SUNPHARMA
865
877
884
896
904
TCS
3,227
3,256
3,299
3,328
3,371
TATACONSUM
778
794
803
818
827
TATAMOTORS
442
451
457
466 471
TATASTEEL 102 105
106
109
111
TECHM
1,038
1,052
1,061 1,075
1,084
TITAN
2,359
2,419
2,461
2,521
2,563
ULTRACEMCO
6,319
6,407
6,494 6,582
6,668
UPL
728
744
753
769
778
WIPRO
407
412
415 420
424
www.angelone.in
Technical & Derivatives Report
Aug 24, 2022
*
Technical and Derivatives Team:
Sameet Chavan Chief Analyst – Technical & Derivatives sameet.chavan@angelone.in
Sneha Seth Senior Analyst – Technical & Derivatives sneha.seth@angelone.in
Rajesh Bhosale Technical Analyst rajesh.bhosle@angelone.in
Osho Krishan Senior Analyst – Technical & Derivatives osho.krishan@angelone.in
Research Team Tel: 022 – 39357600 (Extn. 6844) Website: www.angelone.in
For Technical Queries E-mail: technicalresearch-cso@angelone.in
For Derivatives Queries E-mail: derivatives.desk@angelone.in
DISCLAIMER
Angel One Limited (hereinafter referred to as “Angel”) is a registered Member of National Stock Exchange of India Limited, Bombay
Stock Exchange Limited and Metropolitan Stock Exchange Limited. It is also registered as a Depository Participant with CDSL and
Portfolio Manager and investment advisor with SEBI. It also has registration with AMFI as a Mutual Fund Distributor. Angel One
Limited is a registered entity with SEBI for Research Analyst in terms of SEBI (Research Analyst) Regulations, 2014 vide registration
number INH000000164. Angel or its associates has not been debarred/ suspended by SEBI or any other regulatory authority for
accessing /dealing in securities Market.
This document is solely for the personal information of the recipient, and must not be singularly used as the basis of any investment
decision. Nothing in this document should be construed as investment or financial advice. Each recipient of this document should
make such investigations as they deem necessary to arrive at an independent evaluation of an investment in the securities of the
companies referred to in this document (including the merits and risks involved), and should consult their own advisors to determine
the merits and risks of such an investment.
Angel or its associates or research analyst or his relative may have actual/beneficial ownership of 1% or more in the securities of
the subject company at the end of the month immediately preceding the date of publication of the research report. Neither Angel or
its associates nor Research Analysts or his relative has any material conflict of interest at the time of publication of research report.
Angel or its associates might have received any compensation from the companies mentioned in the report during the period
preceding twelve months from the date of this report for services in respect of managing or co-managing public offerings, corporate
finance, investment banking or merchant banking, brokerage services or other advisory service in a merger or specific transaction
in the normal course of business. Angel or its associates did not receive any compensation or other benefits from the companies
mentioned in the report or third party in connection with the research report. Neither Angel nor its research analyst entity has been
engaged in market making activity for the subject company.
Reports based on technical and derivative analysis center on studying charts of a stock's price movement, outstanding positions and
trading volume, as opposed to focusing on a company's fundamentals and, as such, may not match with a report on a company's
fundamentals. Investors are advised to refer the Fundamental and Technical Research Reports available on our website to evaluate
the contrary view, if any.
The information in this document has been printed on the basis of publicly available information, internal data and other reliable
sources believed to be true, but we do not represent that it is accurate or complete and it should not be relied on as such, as this
document is for general guidance only. Angel One Limited or any of its affiliates/ group companies shall not be in any way responsible
for any loss or damage that may arise to any person from any inadvertent error in the information contained in this report. Angel One
Limited has not independently verified all the information contained within this document. Accordingly, we cannot testify, nor make
any representation or warranty, express or implied, to the accuracy, contents or data contained within this document. While Angel
One Limited endeavors to update on a reasonable basis the information discussed in this material, there may be regulatory,
compliance, or other reasons that prevent us from doing so.
This document is being supplied to you solely for your information, and its contents, information or data may not be reproduced,
redistributed or passed on, directly or indirectly.
Neither Angel One Limited, nor its directors, employees or affiliates shall be liable for any loss or damage that may arise from or in
connection with the use of this information. Angel or its associates or Research Analyst or his relative might have financial interest
in the subject company. Research analyst has not served as an officer, director or employee of the subject company.
