
Divergence is a technical indicator that signals a possible trend reversal. It occurs when the price movement of an asset and the readings of a technical indicator don’t confirm each other. There are two main types of divergences: bullish divergence and bearish divergence.
A bullish divergence indicates a possible trend reversal from a downtrend to an uptrend. The price makes lower lows (each price trough is lower than the previous one). But the Relative Strength Index (RSI), makes higher lows (each trough in the RSI’s value is higher than the previous one). This suggests that even though the price keeps dropping, the selling pressure is weakening. The RSI showing the stock is nearing oversold territory, hinting at a potential price reversal.
On the other hand, a bearish divergence suggests a possible trend reversal from an uptrend to a downtrend. The price makes higher highs (each price peak is higher than the previous one). But the RSI makes lower highs (each peak in the RSI’s value is lower than the previous one). This divergence suggests that despite the price climbing, the buying momentum is slowing down. The RSI might be signalling the Stock is nearing overbought territory, indicating a potential price reversal.
Following are the three stocks has formation of bearish divergence:
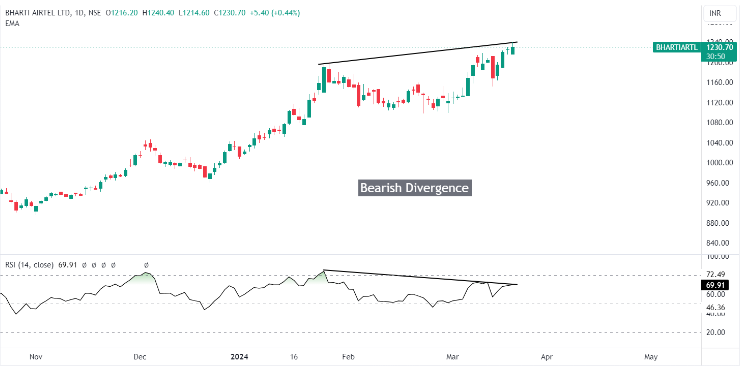
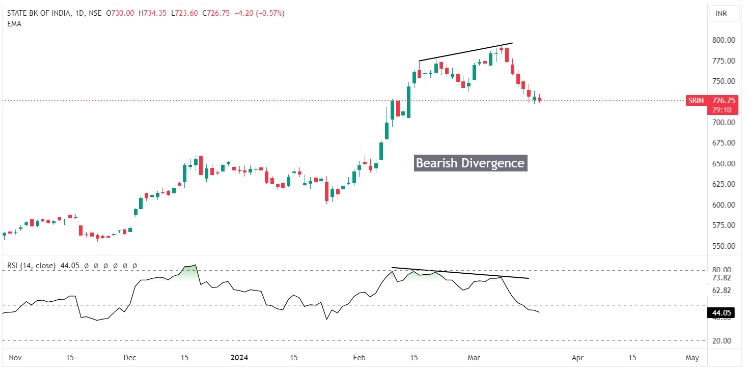
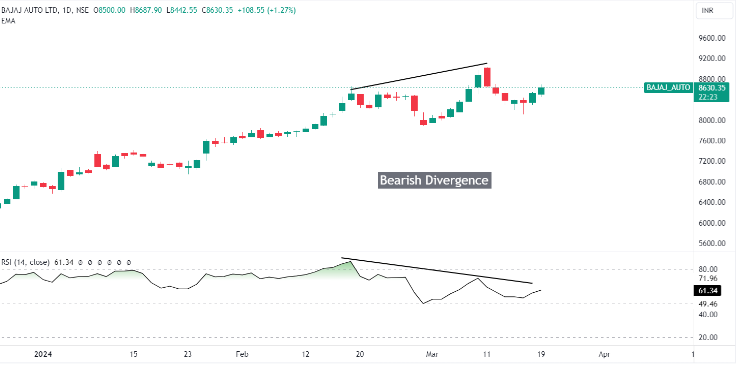
Above all, three stocks are witnessing bearish divergence. The Bharti Airtel share price is still rising as the strength is not in support, but if the RSI crosses the prior high, then the bearish divergence becomes invalid. For the chart of the State Bank of India, the technical setup was so perfect that the divergence confirms the recent crash in the stock price where peaks were not in sync with RSI peaks. Lastly, in the chart of Bajaj Auto, the divergence is present, but it is still in indecisive form. If RSI crosses the prior lower high, then the divergence becomes invalid.
Following are the three stocks has formation of bullish divergence:
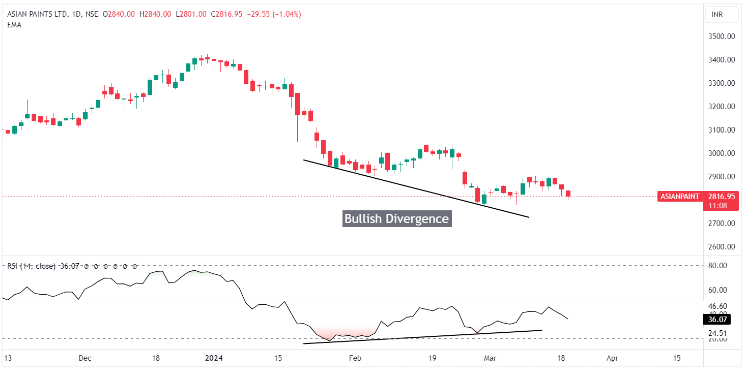
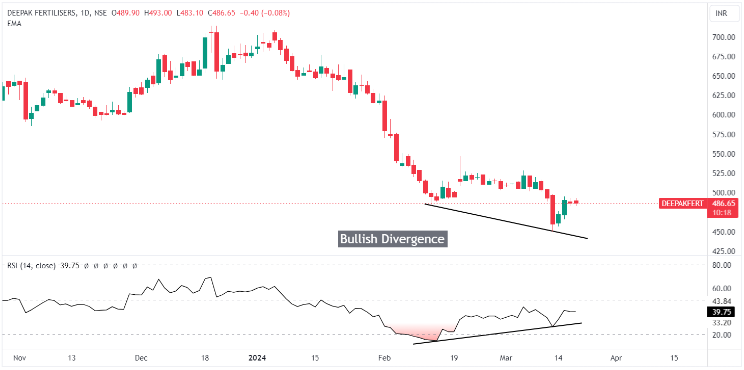
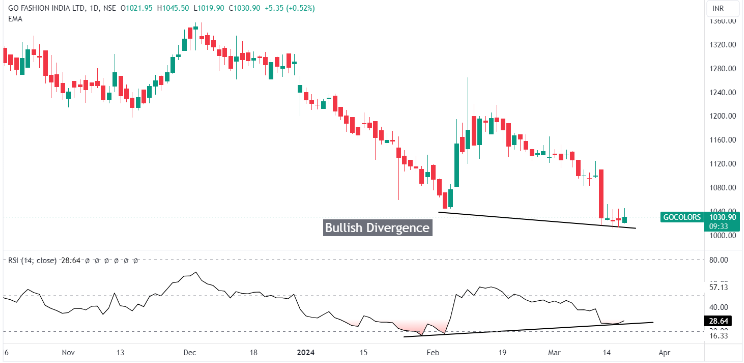
Above all, three stocks are witnessing bullish divergence. The Asian Paints share price dropping as the strength is still there, but if the price doesn’t form higher low and closes below prior lower low, then the bullish divergence becomes invalid. For the chart of the Deepak Fertilisers, the technical setup was so perfect that the divergence confirms the recent bounce in the stock price where the stock price must cross the prior high. Lastly, in the chart of Go Fashion India, the divergence is present, but it is still in indecisive form. If RSI crosses the prior lower low, then the divergence becomes invalid.
By understanding bullish and bearish divergences, traders can gain valuable insights into potential trend changes and make more informed trading decisions.
Disclaimer: This blog has been written exclusively for educational purposes. The securities mentioned are only examples and not recommendations. The information is based on various secondary sources on the internet and is subject to change. Please consult with a financial expert before making investment decisions.
Published on: Mar 19, 2024, 5:04 PM IST
We're Live on WhatsApp! Join our channel for market insights & updates

Get the link to download the App

