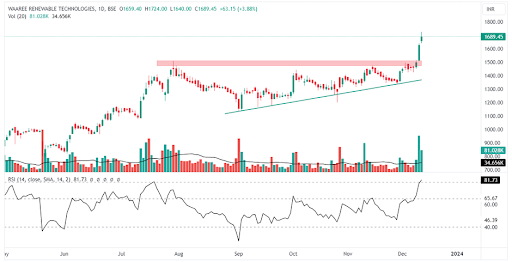
Waree Renewables is a strong positive breakout candidate with price volume support. The stock price is currently trading at Rs 1,689 and has witnessed the formation of an ascending triangle chart pattern. The RSI, ADX and other parameters of technical analysis are in sync with the breakout.
An ascending triangle is a chart pattern in technical analysis that indicates a potential breakout to the upside. It is formed when the price of an asset fluctuates between a horizontal upper trendline and an upward-sloping lower trendline, creating a triangle shape that points upwards.
This line connects the highest price peaks of the triangle. It acts as a resistance level that the price struggles to break above. This line connects the lowest price troughs of the triangle. It indicates a gradual increase in buying pressure as the price makes higher lows. As the triangle progresses, the upper and lower trendlines converge towards each other, narrowing the price range and creating a sense of compression.
The ascending triangle is generally considered a bullish continuation pattern. This means that it occurs during an ongoing upward trend and suggests that the price is likely to continue rising once it breaks out of the triangle. The breakout typically occurs when the price closes above the upper trendline with increasing volume. This confirms that buyers are gaining control and pushing the price higher.

1-day chart of Waaree Renewable Technologies
Waaree Renewable Technologies’ stock trading with a strong green candle day progresses to continue the breakout rally of a chart pattern called an ascending triangle chart pattern.
The stock witnessed a gap-up opening at Rs 1,659, jumped to its day high of Rs 1,724, and touched its day low of Rs 1,640. The stock has been in an uptrend for a long time.
Waaree Renewable Technologies has formed an ascending triangle chart pattern with its breakout to continue the bullish trend. The stock price is trading at its all high and may consolidate for a while to cool down this breakout as the day candle faces pressure from sellers. The stock continues to trade at its 52-week high with high momentum, as the power sector is booming. The stock price also witnessed a price volume breakout on Monday making this breakout strong with a spurt in volume more than 3 times.
The relative strength index also entered the 80–100 range, suggesting the stock price may face an overbought situation and cool down. The ADX indicator line is also turned upside to cross the 20 level, showing the strong emergence of the price. The stock price also respects the moving average levels as it bounced from the same 8 days ago.
During any corrective moves, the major support level to watch for is Rs 1,500. The overall structure remains favourable for traders, as the stock continues to trade above all its important moving averages, indicating a sustained upward trend.
The stock has given multibagger returns of 11,762.22% over a decade.
Waaree Renewable Technologies Ltd is engaged in the generation of power through renewable energy resources.
Disclaimer: This blog has been written exclusively for educational purposes. The securities mentioned are only examples and not recommendations. The information is based on various secondary sources on the internet and is subject to change. Please consult with a financial expert before making investment decisions.
Published on: Dec 12, 2023, 6:12 PM IST
We're Live on WhatsApp! Join our channel for market insights & updates
