
State Bank of India and Shyam Metalics & Energy are identified as upside potential stocks based on technical analysis. Both stocks have displayed promising technical patterns, including price volume support and the potential to bounce back. Currently, trading at Rs 768.20 and Rs 671.20, respectively, their price structures align with positive signals from technical indicators like RSI and ADX, suggesting momentum.
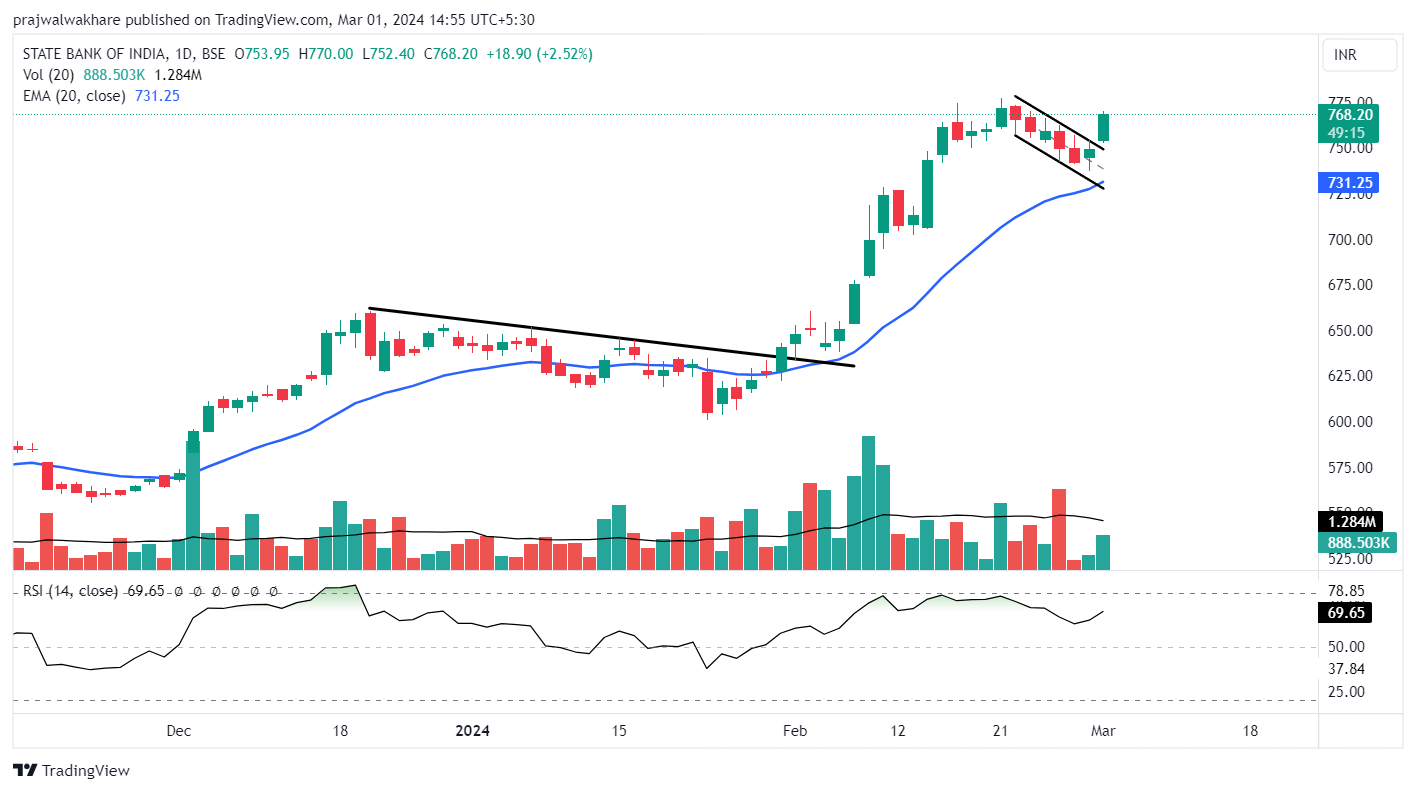
State Bank of India is currently displaying a flag breakout on the daily chart; the stock price trading with momentum with a strong green candle with a gap-up opening. If the stock manages to hold the current level with the support of the good volume, the stock price may start the strong momentum up move in the next coming trading sessions again. Today’s volume highlights active buyer participation with above-average daily volume today.
Friday’s trading session began at Rs 753 and reached a peak of Rs 771 forming a marubozu candle at the time of writing. After opening the stock has successfully surged towards the day high on the chart, indicating a potential support sign for the coming uptrend.
The current stock price is trading with a bullish green candle trying to close as a marubozu candlestick pattern probably as a sign of strength, driven by increased volume during a particular trading session, indicating that investors are interested in up moves. In the coming time, the stock price may show momentum as it is reversing from the 20-EMA, it may set the stock up for a stronger positive trend shift, and the accumulated volume suggests further growth soon.
On the RSI chart, the relative strength index is trading in the bullish zone with gaining strength, and ADX trading at 45 indicates super strong directional strength, favouring high momentum on either side. In the event of a retracement, it is essential to monitor key support levels, particularly at Rs 730. The minor upper resistance is the 52-week high, and if the stock starts back-to-back closing above the 52-week high, then the stock may consistently trade above current levels.
State Bank of India is a public sector banking and financial services statutory body.
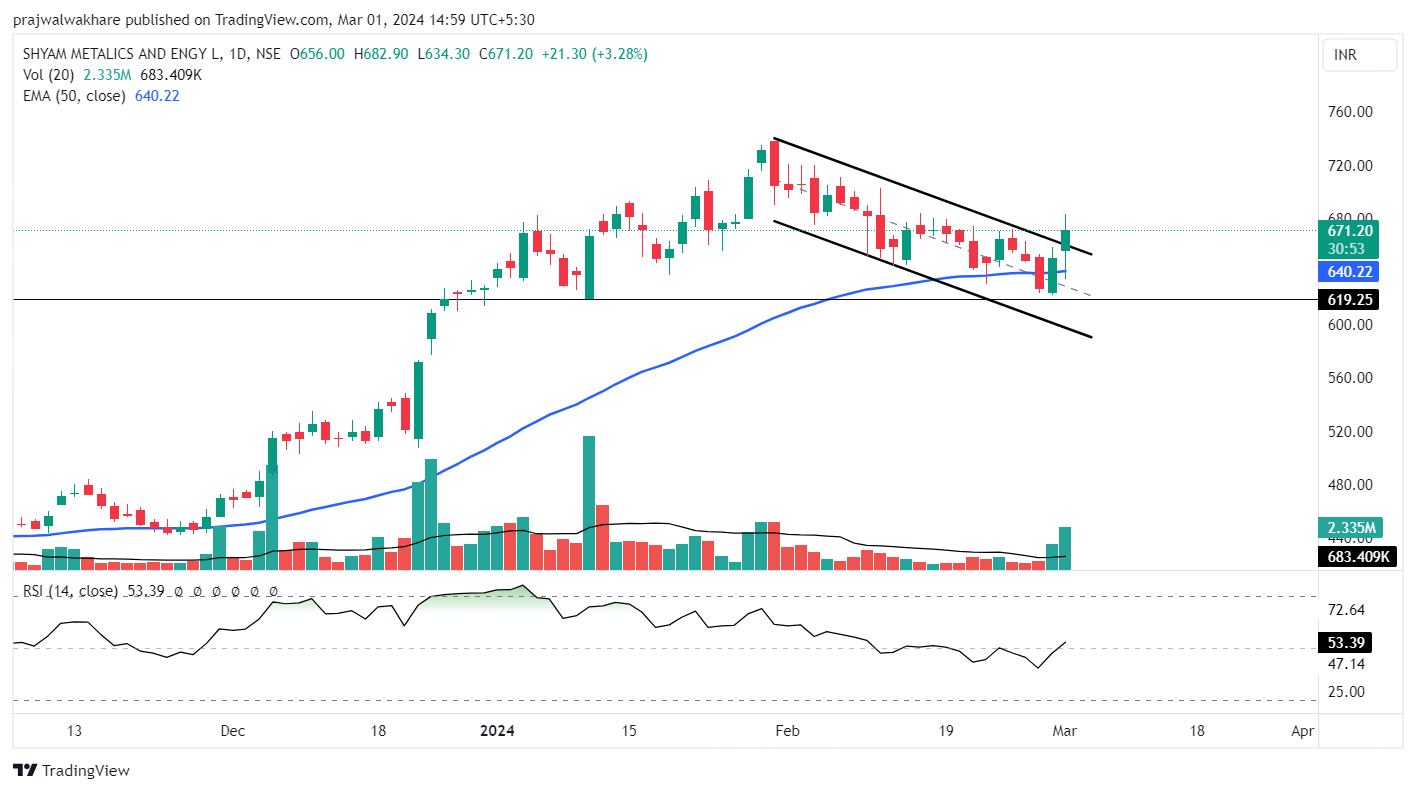
Daily chart Shyam Metalics & Energy Ltd
Shyam Metalics & Energy’s current stock performance is characterised by a promising technical setup, trading at Rs 671.20 and has the potential to start its strong long-term uptrend, accompanied by a significant increase in trading today. Currently, the stock price picking up after touching the support level.
Starting at Rs 656 on Thursday, the stock reached an intraday high of Rs 682. The current upsurge of the day was notable as the volume also picked up.
The stock has bounced and traded around the 50-day EMA, indicating buying activity. After reaching its 52-week high the stock may witness a strong uptrend and the same is anticipated in coming trading sessions, following sustained levels above Rs 670. The current market action is supported by a surge in volume on up days and dry volume on down days for the stock.
The relative strength index (RSI) recently traded in a bullish range at 53.39 suggesting the potential for a significant upward movement in the stock price as the RSI trades into the neutral region. The ADX (Daily), currently at 15, indicates strong directional strength. The level at Rs 620 serves as a crucial indicator for corrective movements after, and the overall market structure favours traders if the stock consistently trades above major moving averages.
Shyam Metalics & Energy Ltd. engages in the manufacture and sale of ferroalloys, iron and steel products and power generation.
Disclaimer: This blog has been written exclusively for educational purposes. The securities mentioned are only examples and not recommendations. The information is based on various secondary sources on the internet and is subject to change. Please consult with a financial expert before making investment decisions.
Published on: Mar 1, 2024, 6:14 PM IST
We're Live on WhatsApp! Join our channel for market insights & updates

Get the link to download the App

