
Infosys and Interglobe Aviation are identified as upside potential stocks based on technical analysis. Both stocks have displayed promising technical setup, including price volume action before and a potential to bounce back and breakout. Currently trading at Rs 1,653.30 and Rs 699.90 respectively, their price structures align with positive signals from technical indicators like RSI and ADX, breakout scenario in coming time.
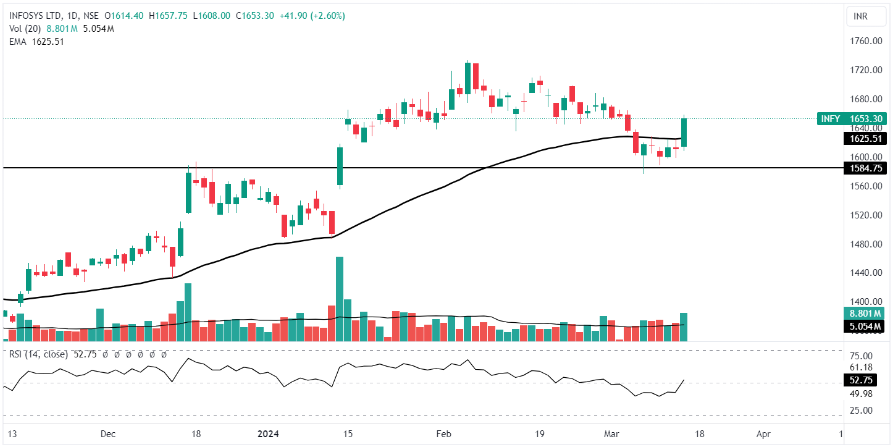
Daily chart of Infosys Ltd
Infosys Ltd exhibited a notable rise from its higher low and experienced trading volume surpassing the 20-day average. With support identified at Rs 1585 and crossing the 50-day EMA, the stock shows promising signs.
The stock of Infosys Ltd has been displaying positive momentum, evident from its current trading price of Rs 1656.35, marking a 2.79% increase from the previous close. Furthermore, indicators like the Relative Strength Index (RSI) at 52.75 and Average Directional Index (ADX) at 19.40 hint at a strengthening trend. Although the one-month returns stand at -1.86%, the overall trajectory seems optimistic.
Traders might consider an entry at the current level or today’s closing price, with a calculated stop loss at Rs 1600. The target could be set near the 52-week high, taking advantage of the bullish momentum.
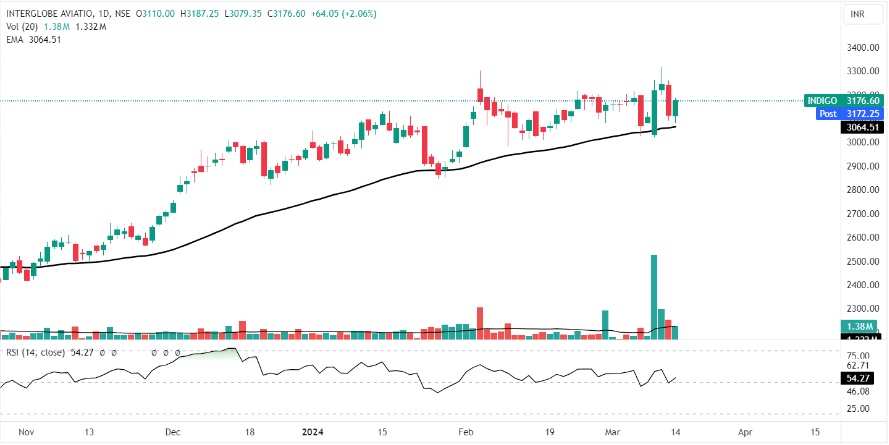
Daily chart of Interglobe Aviation Ltd
Interglobe Aviation Ltd has been steadily maintaining its uptrend, supported by a substantial volume trade observed three days ago. Currently trading above the 50-day Exponential Moving Average (EMA), the stock indicates a robust bullish sentiment.
With a trading price of Rs 3178.45, reflecting a 2.12% increase from the previous close, Interglobe Aviation Ltd showcases favorable technical indicators. The RSI stands at 54.27, suggesting a balanced buying pressure, while the ADX at 14.33 hints at a moderate trend strength. Over the past month, the stock has delivered a commendable return of 4.09%.
Traders could consider entering the market at the current level or today’s closing, backed by a calculated stop loss at Rs 3070.44. The target could aim above the 52-week high, leveraging the ongoing bullish momentum.
Disclaimer: This blog has been written exclusively for educational purposes. The securities mentioned are only examples and not recommendations. The information is based on various secondary sources on the internet and is subject to change. Please consult with a financial expert before making investment decisions.
Published on: Mar 14, 2024, 6:22 PM IST
We're Live on WhatsApp! Join our channel for market insights & updates

Get the link to download the App

