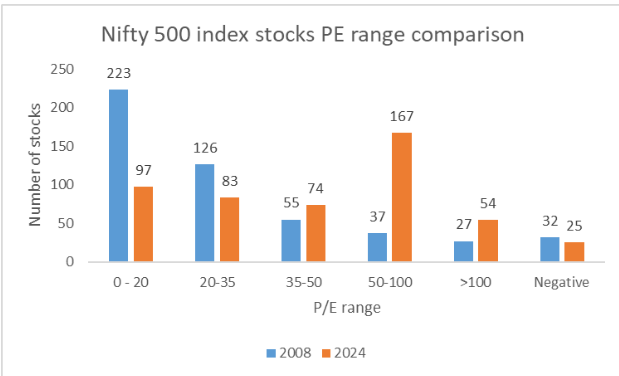
NSE 500 provides a broader picture of Indian equity markets, representing 91.8% free-float market capitalisation. An analysis of P/E, a valuation metric constituent of this NSE 500 gives a broader understanding of India’s equity markets’ expensiveness. With 33% of NSE 500 constituent trading in the P/E range of 50 -100 in August 2024 versus merely 7% in January 2008, this picture represents an increase in stocks with high valuations.
The NSE 500 index represents the top 500 companies based on full market capitalisation from the eligible universe. It provides a broader picture of Indian equity markets and represents about 91.8% of the free float market capitalization of the stocks listed on NSE as of March 28, 2024.
The Price to Earnings Ratio (P/E ratio) is a valuation metric that compares a company’s stock market price with its earnings per share (EPS). It is a key valuation metric indicating if a stock is overpriced or underpriced. The P/E ratio represents how much price the investor (i.e current market price per share) is paying to earn ₹1 of income ( i.e earning per share)
The ‘P’ in the numerator represents the current market price, while the ‘E’ in the denominator represents EPS.
Price to Earnings Ratio = Market Price Per Share divided by Earning Per Share
| Particulars | January 2008 | August 2024 | ||
| TTM P/E Range | Number of Companies | Mix % | Number of Companies | Mix % |
| 0 – 20 | 223 | 45% | 97 | 19% |
| 20-35 | 126 | 25% | 83 | 17% |
| 35-50 | 55 | 11% | 74 | 15% |
| 50-100 | 37 | 7% | 167 | 33% |
| >100 | 27 | 5% | 54 | 11% |
| Negative | 32 | 6% | 25 | 5% |
| Grand Total | 500 | 100% | 500 | 100% |
(Source – Screener )
In January 2008, the NSE 500 market cap was valued at almost Rs 66.7 lakh crore, which has grown 5 times to Rs 415 crore in August 2024. This depicts the bull run of Indian equities, however, it also highlights concern with respect to Indian equity market valuations.
Theoretically, stocks with a high P/E ratio mean that stock is expensive, indicating that the stock price is high relative to its earnings, and stock is overvalued. A low P/E ratio can mean that the stock is cheap and indicates that the stock is undervalued. However, practically it must be understood that a low-growth company might be expensive at a 12x PE Ratio while a high-growth company might be cheap at 35x PE, therefore P/E may exactly depict the true valuation.
Also, it is to be noted that the NSE 500’s earnings of constituents have grown over 3 times since 2008. Further in the last 12 months, the earnings have grown over 25%, this rise in earnings has fuelled the optimism in the stock market, leading to a surge in stock prices.
As of August 2024, over 167 stocks, representing 33% of NSE 500 trades in the P/E range of 50-100 compared with January 2008’s only 37 stocks representing a mix of 7%.
Stock with P/E above 100 has also doubled since January 2008 from a mix of 5% to 11% in August 2024.
Stocks with P/E below the 0-20 range have fallen in August 2024 to only 97 stocks versus 223 stocks in January 2008, further stock with negative P/E has also fallen from 32 stocks in January 2008 to 25 stocks in August 2024. This drop in low or negative P/E indicates the increase in stocks with higher or positive P/E.

P/E ratio is just one metric, and on its own cannot be used to conclude whether markets are under or overvalued. It also has certain limitations such as not considering a company’s debt, cashflow positions, material information about the quality of earnings and other growth indicators. Therefore before making investment decisions, other factors shall also be considered.
Disclaimer: This blog has been written exclusively for educational purposes. The securities mentioned are only examples and not recommendations. It is based on several secondary sources on the internet and is subject to changes. Please consult an expert before making related decisions.
Published on: Sep 5, 2024, 1:54 PM IST
We're Live on WhatsApp! Join our channel for market insights & updates
