
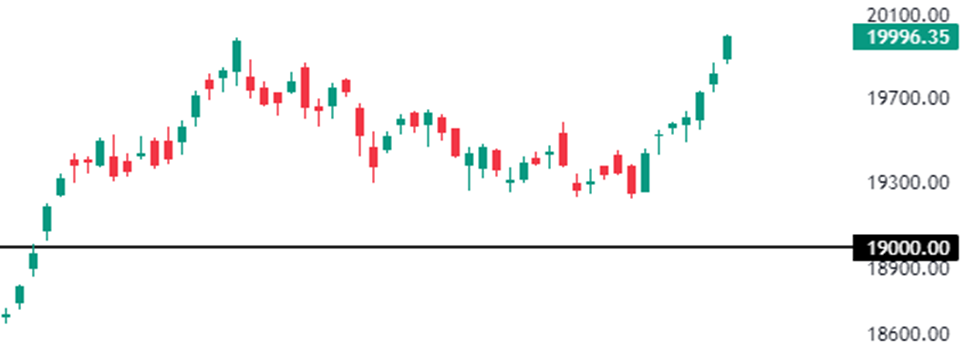
India’s most-traded NSE index, Nifty50, reached a significant milestone of 20,000 on September 11, 2023.
It opened the day at 19,890, which was 0.35% or 70 points higher than its previous day’s closing level of 19,820. During the intraday session, it reached a high of 20,008 in the closing hours of today’s trading session.
Finally, Nifty50 concluded the day at 19,996.35, which was 176.40 points or 0.89% higher than its previous closing. Meanwhile, the Nifty50 futures contract for the current month’s expiry ended the day at 20,046 levels.
If we analyse the historical data, we can see that on June 28, Nifty50 reached the 19,000 level. Within 22 days, it surged to an all-time high of 19,991.85, marking a 991.85-point rally.
After this peak, there was some profit booking, causing it to decline to 19,388. It established a strong support base around the 19,300 level. From there, it regained momentum and experienced a robust rally of 620 points and hit an all-time high of 20008 today.
Interestingly, it took nearly 42 days to fall from the previous all-time high to 19,388, but only seven trading sessions or 11 days to reach this significant milestone. However, it took 75 days to travel 1000 points from 19,000 to 20,000.
Following are the companies that have performed well and supported Nifty to touch significant levels during the last three months:
| Company Name | CMP Rs | 3-months Return % |
| NTPC | 243 | 30 |
| Cipla | 1,248 | 27 |
| Larsen & Toubro | 2,897 | 23 |
| Coal India | 279 | 23 |
| Dr Reddy Laboratories | 5,610 | 19 |
| ONGC | 184 | 19 |
| Tech Mahindra | 1,265 | 17 |
| Tata Steel | 131 | 17 |
| Sun Pharma Industries | 1,138 | 14 |
| Mahindra & Mahindra | 1,581 | 14 |
Let’s move on to the FIIs and DIIs data. According to our analysis, whenever the FIIs were net sellers in any financial year, the market performed remarkably the very next year.
Interestingly, for the past two financial years continuously, FIIs have been net sellers, and in FY24, it may repeat history by delivering a strong rally and generating impressive returns.
Following are the FIIs and DIIs month-wise data starting from January 2023:
| Month | FIIs (Rs in Cr) | DIIs (Rs in Cr) | Nifty Closing | % Change |
| Sep-23 | -8,833.47 | 6867.07 | 19996.35 | 3.9% |
| Aug-23 | -26,056.26 | 25016.95 | 19253.8 | -2.5% |
| Jul-23 | 11,155.69 | -2697.66 | 19753.8 | 2.9% |
| Jun-23 | 31,043.69 | 4458.23 | 19189.05 | 3.5% |
| May-23 | 27,351.08 | -3306.35 | 18534.4 | 2.6% |
| Apr-23 | 16,430.95 | 2216.57 | 18065 | 4.1% |
| Mar-23 | 2,144.88 | 30548.77 | 17359.75 | 0.3% |
| Feb-23 | -15,899.55 | 19239.28 | 17303.95 | -2.0% |
| Jan-23 | -49,155.00 | 33411.85 | 17662.15 | -2.4% |
Below is the chart presentation of Nifty50 in the daily time frame:
Disclaimer: This blog has been written exclusively for educational purposes. The securities mentioned are only examples and not recommendations. It is based on several secondary sources on the internet and is subject to changes. Please consult an expert before making related decisions.
Published on: Sep 11, 2023, 6:24 PM IST
We're Live on WhatsApp! Join our channel for market insights & updates

Get the link to download the App

