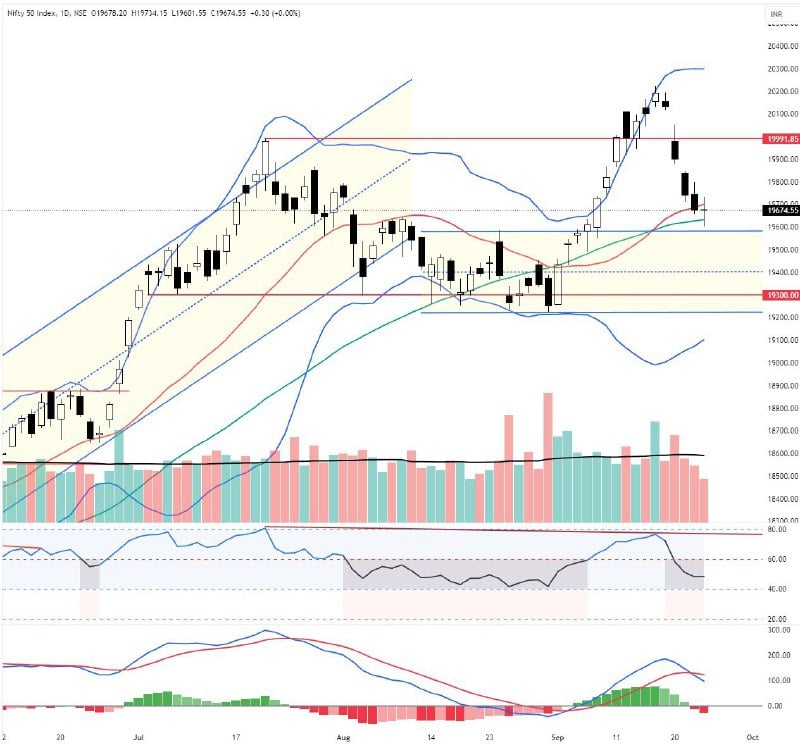
The Nifty has formed a Doji candle after a decline of over 3%. Previously, it found support at the 50DMA, as we discussed. The bounce from the 19,585-19,626 support zone is now a reality. The index closed flat, indicating exhaustion in the trend. Now, Monday’s low of 19,601 is a crucial support for the time being. As long as the index trades above this level, maintain a positive outlook. In any case, a close above the 20 DMA of 19,721 may extend the bounce up to the 19,880-19,912 resistance zone. We need to monitor the price action around this level. With the expiry scheduled in the next three days, caution is warranted. The positive divergence in RSI is clearly visible on an hourly chart. It closed just above the 40 zone, with signals emerging from an oversold zone. The hourly MACD has generated a bullish signal. Monday’s volumes were lower, indicating that traders are not keen on initiating fresh aggressive positions. However, open interest is up by 12.06%, indicating long buildup. In the derivative segment, there are 104 stocks showing long buildup. This data suggests that the index has formed a short-term bottom at the 19,601 level. The formation of a higher low candle is sufficient for a pullback towards the 19,880 resistance zone. It is advisable not to hold short positions for now and maintain a neutral to positive bias.

The Nifty 50 has formed a positive divergence on the RSI in the hourly timeframe and closed above the 40 zone, which is a positive sign. A move above the level of 19,670 is positive, with potential testing of the upside level at 19,765. Maintain a stop loss at the level of 19,600. Above the level of 19,765, continue with a trailing stop loss. Conversely, a move below the level of 19,600 is negative and may test the level of 19,530. Maintain a stop loss at the level of 19,670. Below 19,530, continue with a trailing stop loss.
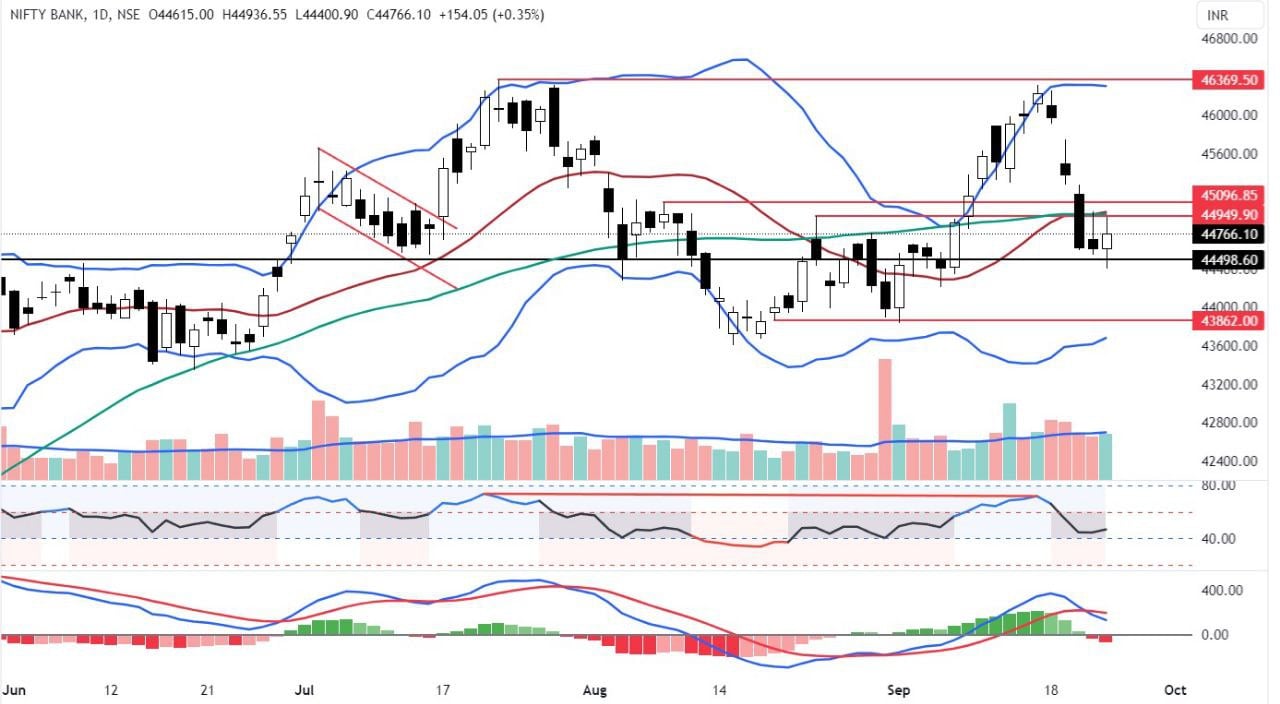
The Bank Nifty has formed a long-legged candle with higher volume. It closed positively, suggesting the index may have formed a short-term bottom. The index encountered resistance at the 20 and 50 DMAs, which are currently moving horizontally. The 44,400-45,000 zone has acted as both support and resistance multiple times in the past. As long as the index holds this support zone, we may witness an extension of the pullback towards Thursday’s gap area. If all goes well, it may potentially test the level of 45,355, where the Anchored VWAP resistance, as well as the 50% retracement level, are situated. The RSI has flattened and is showing some upward movement from the 40 zone. On the hourly chart, the RSI has formed a positive divergence, which could support the pullback efforts. The higher volume indicates a positive bias for now. The index may enter into a counter-trend consolidation phase before establishing a clear direction. Maintain a neutral to positive bias.

The Bank Nifty shows signs of a pullback rally. A move above the level of 44,800 is positive, with potential testing of the level at 45,000. Maintain a stop loss at the level of 44,730. Above the level of 45,000, continue with a trailing stop loss. However, a move below the level of 44,730 is negative and may test the level of 44,460. Maintain a stop loss at the level of 44,800. Below 44,460, continue with a trailing stop loss.
Disclaimer: This blog has been written exclusively for educational purposes. The securities mentioned are only examples and not recommendations. It is based on several secondary sources on the internet and is subject to changes. Please consult an expert before making related decisions.
Published on: Sep 26, 2023, 9:04 AM IST
We're Live on WhatsApp! Join our channel for market insights & updates
