The Nifty tested the gap area once again and failed to close above it. Although it opened at a 17-day high, it faced selling pressure in the afternoon session. The Nifty closed above the three-day high and negated the evening star implications. The hourly chart shows that selling pressure was accompanied by higher volumes. It formed a bearish candle in the first hour itself and failed to move above the first-hour high. The 61.8% retracement level of the prior fall is at 19882. The gap area of 19848-878 has become a crucial resistance zone. The index now closed above the 20 DMA. The MACD shows an improved bullish momentum as the index closed at the 17-day high. All the sector indices closed positively, indicating broader market participation in Tuesday’s rally. As mentioned earlier, October is historically the most bullish month. In the last five years, the Nifty has never closed below its opening in October. Out of 10 years, it closed above the open for 9 years. In 15 years, 73 percent of the time, and in the last 20 years, 70 percent of the time, it closed higher than it opened. This October, Nifty opened at 19623. History suggests a high probability of closing above 19623 on October 31. With this historical data, we can assume that the Nifty will continue to consolidate even in the second half of this month. Stay with a neutral bias as long as it trades above 19500 and below 19883, and apply range-bound strategies.

The Nifty faced resistance at the previous high. A move above 19845 is positive, and it can test 19883. Maintain a stop loss at 19800. Above 19883, continue with a trailing stop loss. However, a move below 19780 is negative and can test 19740. Maintain a stop loss at 19845. Below 19740, continue with a trailing stop loss.
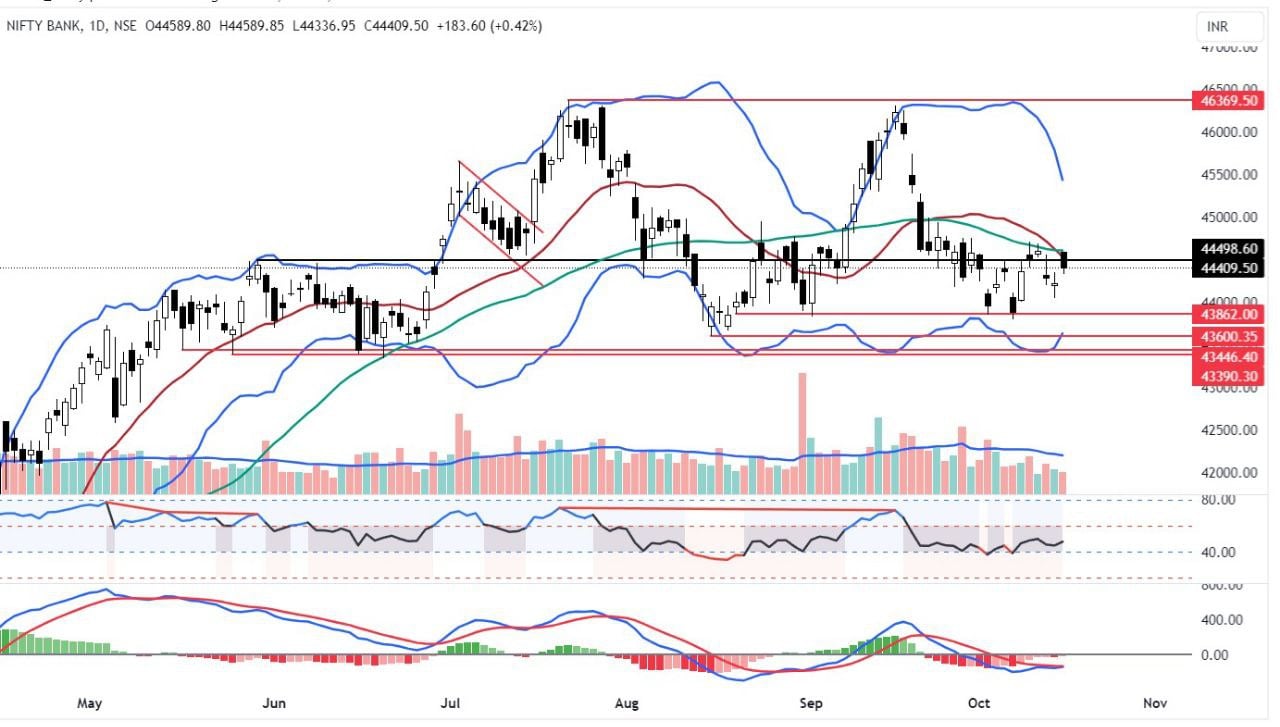
The Bank Nifty formed an open = high candle, which is also called a bearish belt hold pattern. It tested the 20 DMA and 50 DMA. For the last 13 days, the index has been trading in the 43850-44755 zone. Even though it closed above the prior day’s high, the price structure is not bullish. The Bollinger bands have contracted further. Any further contraction will result in an impulsive move. The index may trade within the 44700-43800 zone for the weekly expiry today. This range may extend for another one or two days. On an hourly chart, it formed two big bearish candles, and the price action is limited within these candles. Volumes were lower in the last three days. The RSI and MACD show a lack of momentum. Even on the hourly chart, the index closed within the moving average ribbon, which is a neutral signal. The hourly MACD is also on the zero line and shows no momentum. It is better to maintain a neutral bias on the weekly expiry day.

The Bank Nifty failed to sustain itself at higher levels. A move above 44463 is positive, and it can test 44620. Maintain a stop loss at 44380. Above 44620, continue with a trailing stop loss. However, a move below 44380 is negative and can test 44205. Maintain a stop loss at 44465. Below 44205, continue with a trailing stop loss.
Disclaimer: This blog has been written exclusively for educational purposes. The securities mentioned are only examples and not recommendations. It is based on several secondary sources on the internet and is subject to changes. Please consult an expert before making related decisions.
Published on: Oct 18, 2023, 8:05 AM IST
We're Live on WhatsApp! Join our channel for market insights & updates
