The Indian equity market’s journey this past week resembled that of a sprinter—starting with a burst of energy but ending like an exhausted marathoner. For most of the week, the markets began strong but struggled to maintain momentum by the end of the trading day. However, on Friday, the NSE benchmark Nifty50 index managed to close above the 23,400 mark for the first time in history. For the week, the Nifty50 index closed up by 0.75%.
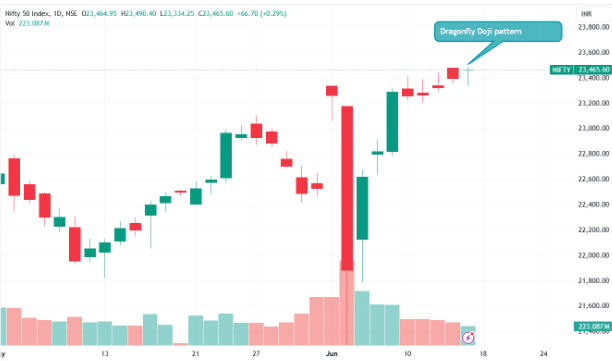
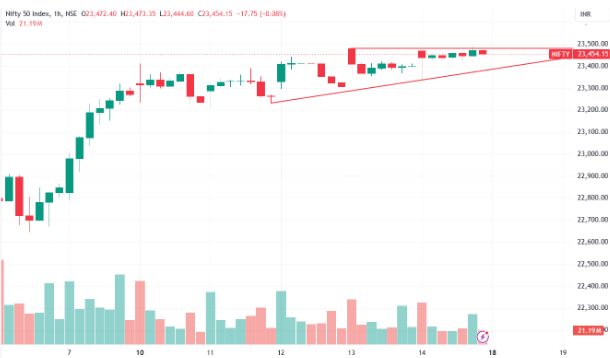
On the daily chart, Friday saw an identical open and close at 23,465 levels, with the formation of a long lower shadow. This indicates the formation of a dragonfly doji candle pattern at the new all-time highs. The Nifty50 continued to show range-bound action within 23,300-23,500 levels, with no early signs of any breakouts on either side. A decisive move above 23,500 levels is likely to open the gates for an upside, while a slide below 23,300 levels could signal a chance of a downside breakout in the near term. Hence, traders need to closely monitor the range of 23,300 to 23,500 in the coming week.

Daily Time Frame

Hourly Time Frame
This week was all about the adage “all’s well that ends well.” The market largely experienced a time-wise correction phase following the sharp upsurge of the previous week. Despite this correction, the Nifty50 index registered its highest-ever close. We don’t see any significant change in the technical setup, and the undertone remains bullish.
Disclaimer: This blog has been written exclusively for educational purposes. The securities mentioned are only examples and not recommendations. It is based on several secondary sources on the internet and is subject to changes. Please consult an expert before making related decisions.
Published on: Jun 14, 2024, 5:59 PM IST
We're Live on WhatsApp! Join our channel for market insights & updates
