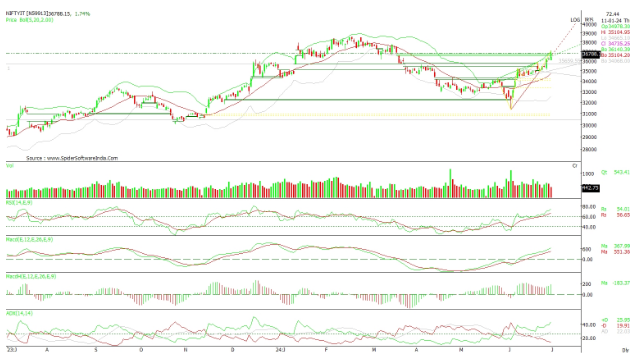
The NSE Nifty IT index is among the best-performing sectors on Monday, gaining almost 2% and reaching its highest level since March 18, 2024.
The NSE Nifty IT index registered its sharpest rise in June in 20 years, with the technology benchmark index surging 11.6% last month. This marks the best monthly returns since June 2003 and stands in contrast to a nearly 7% rise in the NSE Nifty 50 index.
| Year | Gains in % |
| 2024 | 11.6 |
| 2023 | 0.8 |
| 2022 | -6.2 |
| 2021 | 7.6 |
| 2020 | 5.3 |
| 2019 | -1.4 |
| 2018 | 2.4 |
| 2017 | -3.7 |
| 2016 | -2.4 |
| 2015 | -4.6 |
| 2014 | 10.5 |
| 2013 | 2.5 |
| 2012 | 2.3 |
| 2011 | 1.3 |
| 2010 | 2.9 |
| 2009 | 9.1 |
| 2008 | -14.7 |
| 2007 | -0.5 |
| 2006 | 2.3 |
| 2005 | 4.7 |
| 2004 | 3.6 |
Delving deeper, it is observed that July is seasonally the best month for the NSE Nifty IT index, with an average gain of 4% in the month since 2004. In July, the index has logged double-digit gains multiple times.
| Year | % Gain |
| 2020 | 22.5 |
| 2013 | 17.4 |
| 2009 | 23.8 |
If history, which tends to repeat or rhyme, is any indication, the NSE Nifty IT index might continue its rally.
The daily 14-period RSI is at 75.5, surpassing the peak seen in June at 65.48. The daily MACD is pointing northward while sustaining above its nine-period average, validating a positive bias. The Average Directional Index (ADX), which shows trend strength, is as high as 28.8 on a daily chart. Generally, levels above 25 indicate a strong trend. The +DI is above the -DI and ADX, indicating that the trend is in favor of the bulls.

Disclaimer: This blog has been written exclusively for educational purposes. The securities mentioned are only examples and not recommendations. The information is based on various secondary sources on the internet and is subject to change. Please consult with a financial expert before making investment decisions
Published on: Jul 1, 2024, 6:04 PM IST
We're Live on WhatsApp! Join our channel for market insights & updates
