CALCULATE YOUR SIP RETURNS

Open Interest (OI) Profile Plotting On Charts: Made Right Just For You

Written by: Team Angel OneUpdated on: Jan 13, 2025, 12:42 PM IST
F&O trading is evolving fast. Open Interest (OI) shows active contracts, and OI Profile Plotting on charts in the Angel web app helps improve trading with live data.
Open Interest (OI) Profile Plotting On Charts: Made Right Just For You
ShareShare on 1Share on 2Share on 3Share on 4Share on 5

The Futures and Options (F&O) trading area is undoubtedly changing fast. Here, as in all situations, it is essential to know other factors like the market trends which are quite critical. Such trends can best be appreciated through Open Interest (OI). In this case, OI refers to the number of active contracts still outstanding on an asset. Thereafter in this post, a description of how OI Profile Plotting them on Charts helps in enhancing the trading activity of users on the Angel web app by providing them with live data that will help their trades is presented.

What is Open Interest (OI)?

Open interest is essentially the total number of outstanding contracts for a given asset in the market at any particular point in time. In combination with liquidity, it is a very useful tool to help identify the direction of the market. The following note describes some important issues related to OI:

  • Correct Prediction: OI is able to predict market movements better when the assets being evaluated are experiencing a high level of liquidity.
  • Nifty OI Focus: It is no doubt that Nifty weekly OI has been a useful metric for traders.

Why OI Matters for Traders?

When it comes to reading market signals, OI is a must-watch. Here’s why:

  • Spotting Trends: An increase in OI along with price movement might indicate the continuation of a trend, while divergence could signal a potential reversal.
  • Finding Opportunities: OI helps traders identify areas of high interest and volume, which are crucial for spotting trading opportunities.
  • Improving Strategies: By observing OI trends, traders can adjust their strategies in real-time, making more informed decisions.

How OI Profile Works on Angel Web App?

The OI Profile feature is designed to make Open Interest data easy to interpret for traders. Here’s how it enhances the user experience:
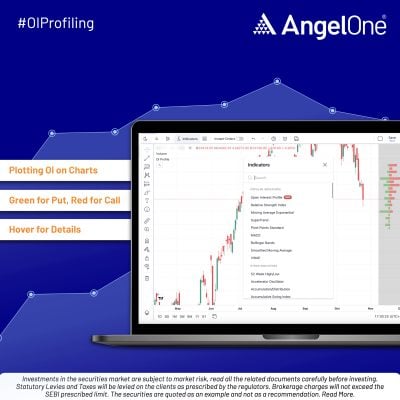
  • Plotting OI on Charts: Horizontal lines indicate the OI values and are provided on F&O charts against the strike prices, showing key support and resistance levels. (Note: OI Profile is only plotted on Futures and underlying charts for both Indices and cash stocks.)
  • Green for Put, Red for Call: The put OI makes it simple to see, the call OI is red whereas the put OI is green.
  • Hover for Details: By hovering over any strike one can see the OI data including the amount of Call and Put OI for the given price.

Additionally:

  • The OI Profile is located on the indicator list.
  • All OI profiles can be applied by users directly from the indicator list.
  • All segments are currently experimenting with OI profiles placed only on underlying charts. This is something that we are in the process of developing and extending the functionality. We will bring this to you soon.

OI Profile as a Must-Have Trading Tool

The Ignition OI Profile Plotting on Charts feature is a leap into the future of F&O trading for users of Angel One. It helps to trade more efficiently as it guides traders in a more comprehensive and straightforward way. Angel One seems well-placed to lead the market as one of the few sites that allow this specific feature to be used in such an optimal manner.

As usual, more details about this amazing feature will be communicated to you soon as we are ready to do clever trading with OI Profile.

Custom Timestamp: Unveil the True Precision

Of course, this feature has been highly valued by traders working with precise OI for decision-making. Combining historical analysis with real-time tracking, the Custom Timestamp feature transforms the way a trader approaches market analysis, giving the kind of edge that’s enough to be ahead in line. Get smarter at the trading experience with tools that are simplified and improved for you.

The Custom Timestamp feature empowers traders with unprecedented precision in analyzing Open Interest (OI) data, making the markets more comprehensively insightful and actionable.

  • Set Specific Timeframes: Traders can define definite start points and end points to analyze the data from the chosen time, providing an expanded outlook of market trends. This will help to identify patterns, spot anomalies, and align strategies with market movement.
  • Historical vs. Real-Time Comparison: With this feature, it’s easy to overlay past OI data with real-time figures. It’s easy to see how market sentiment and liquidity have shifted over time, allowing for robust analysis of trend sustainability or reversals.
  • Refine Trading Strategies: With the help of historical insights combined with live market conditions, traders can fine-tune their strategies. From identifying support and resistance levels to gauging market sentiment, the feature provides actionable data for decision-making.
  • Streamlined Workflow: The fluidity of switching between different timestamps ensures that traders do not lose context or momentum. The workflow remains intact, providing insights directly on the chart without requiring multiple tools or navigation.

Conclusion 

The Custom Timestamp feature improves market analysis in terms of precision, flexibility, and usability. Paired with OI profiling, traders gain even deeper insights into market behavior by analyzing Open Interest distributions across specific timeframes and price levels. This comprehensive view allows for better identification of accumulation or distribution zones, uncovering key market dynamics. 

Whether tracking historical trends or comparing against real-time insights, this tool keeps you ahead in dynamic market conditions. Dive deeper, trade smarter, and gain the edge with Custom Timestamp and OI profiling.


Disclaimer: Investments in securities market are subject to market risks, read all the related documents carefully before investing. Read More

The securities are quoted as an example and not as a recommendation 


This blog is for educational purposes only

Published on: Jan 13, 2025, 12:42 PM IST

Team Angel One

Team Angel One is a group of experienced financial writers that deliver insightful articles on the stock market, IPO, economy, personal finance, commodities and related categories.

Know More

We're Live on WhatsApp! Join our channel for market insights & updates

Open Free Demat Account!

Join our 2 Cr+ happy customers

+91
Enjoy Zero Brokerage on Equity Delivery
4.4 Cr+DOWNLOADS
Enjoy ₹0 Account Opening Charges

Get the link to download the App

Send App Link
Get it on Google PlayDownload on the App Store
Open Free Demat Account!
Join our 2 Cr+ happy customers