
FSN E-Commerce Ventures and NLC India are identified as upside potential stocks based on technical analysis. Both stocks have displayed promising structures and technical setups, including price volume contraction and the potential to bounce back and break out. Currently trading at Rs 161.35 and Rs 228.10 respectively, their price aligns with positive signals from technical indicators like RSI and ADX, suggesting a breakout scenario likely in the coming time.
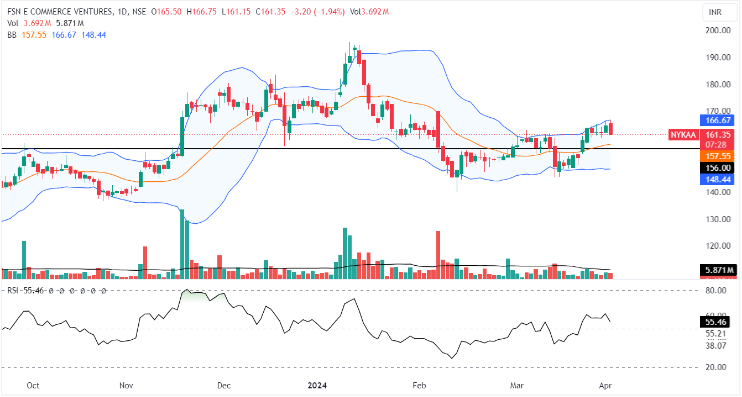
Daily chart of FSN E-Commerce Ventures Ltd
On the daily chart, the FSN E-Commerce Ventures is presently showing a promising picture; the stock price is moving up after crossing the level of Rs 156 and 20-day EMA. The stock price may resume its strong momentum-up in the coming trading sessions if it manages to cross and close above the upper band of the Bollinger band as plotted on the chart, with the support of decent volume compared to the current volume. Volumes are dry right now and likely to rise soon.
Those considering a possible trade-in FSN E-Commerce Ventures might purchase the stock at the present price with a stop loss of Rs 156 on a closing basis and aim to capitalize above its 52-week high.
The stock price is currently trading above both its 20-day EMA, suggesting it is likely about to turn short-term bullish once more. The stock appears quite neutral when one looks at the Relative Strength Index, which is now trading at 55.46. The ADX of 17 indicates the present state of price momentum, which is moving with low momentum.
In the event of a retracement, it is essential to monitor key support levels, particularly at Rs 145. The minor upper resistance is the 52-week high, and if the stock closes above the 52-week high consecutively, then it may consistently trade above current levels.
FSN E-Commerce Ventures Ltd. is a digital technology platform company, which engages in the provision of content-led and lifestyle retail experiences to consumers.
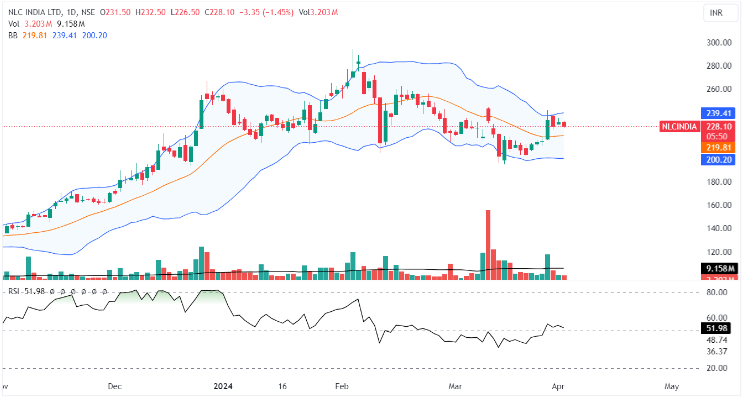
The daily chart of NLC India Ltd
NLC India’s current performance is indicated by a favorable technical setup. The company’s shares are now trading at Rs 228.10 and may continue the uptrend from the current level. The stock price is currently trading slightly above the 50-day EMA.
Those interested in possible trade-in NLC India could purchase the stock at the present price, setting a stop loss below the 50-day EMA at Rs 216, and aim for a target price higher than the stock’s 52-week high.
The stock is trading above its all-important moving averages, and it is expected to find support near Rs 220. The Relative Strength Index is trading near neutral levels at 51.98. This implies there may be potential for an increase in stock price strength. The ADX, now around 20, shows low momentum and directional strength.
The level at Rs 220 serves as a crucial indicator for corrective movement, and the overall market structure favors traders if the stock crosses and trades above the 52-week high.
NLC India Ltd. engages in the provision of mining and energy properties.
Disclaimer: This blog has been written exclusively for educational purposes. The securities mentioned are only examples and not recommendations. The information is based on various secondary sources on the internet and is subject to change. Please consult with a financial expert before making investment decisions.
Published on: Apr 2, 2024, 5:53 PM IST
We're Live on WhatsApp! Join our channel for market insights & updates

Get the link to download the App

