In the world of investing, where growth potential is king, many investors turn to mutual funds focused on companies with high Price-to-Earnings (PE) ratios. These funds, often targeting sectors known for explosive innovation and disruption, promise the potential for significant returns. But with great reward comes great risk.
The PE ratio of a stock provides insight into how much investors are willing to pay per unit of earnings. A high PE ratio suggests overvaluation, while a low ratio may indicate undervaluation compared to peers. For stocks, the PE ratio formula is:
Stock P/E Ratio = Price Per Share / Earnings Per Share (EPS)
Given that equity mutual funds comprise various stocks, their PE ratio is derived from the weighted average of the PE ratios of all underlying stocks, considering their respective allocations within the fund. This average serves as a benchmark, albeit assessing its significance can be nuanced during mutual fund selection. Nevertheless, identifying unusually high or low PE ratios can inform investment decisions.

Source: AMFI
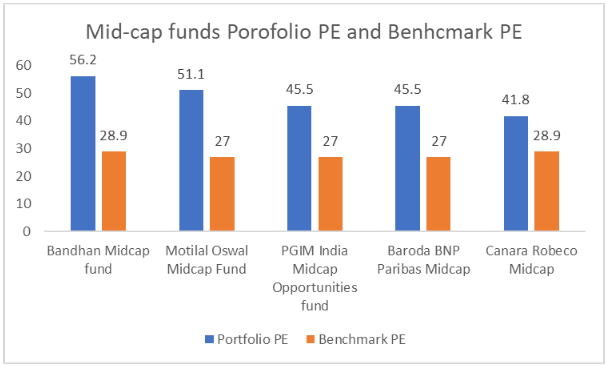
Among mid-cap funds, Bandhan Midcap Fund stands out with a significantly higher portfolio PE ratio of 56.2 compared to its benchmark PE of 28.9, indicating a relatively higher valuation of the stocks in its portfolio. Motilal Oswal Midcap Fund follows closely with a portfolio PE of 51.1, reflecting its relatively higher valuation compared to the benchmark. PGIM India Midcap Opportunities Fund and Baroda BNP Paribas Midcap Fund have portfolio PE ratios of 45.5, slightly above the benchmark PE of 27. Finally, Canara Robeco Midcap Fund has a portfolio PE of 41.8, still higher than its benchmark.

Source: AMFI
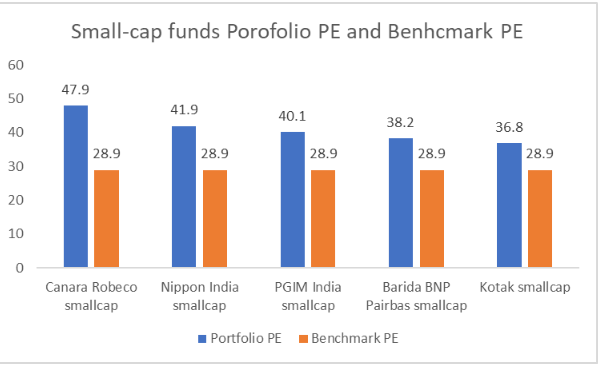
Among small-cap funds, Canara Robeco Small-cap has the highest portfolio PE ratio at 47.9, indicating potentially overvalued stocks compared to its benchmark PE of 28.9. Nippon India Small-cap follows closely behind with a PE ratio of 41.9, suggesting a similar overvaluation. PGIM India Small-cap and Baroda BNP Paribas Small-cap also exhibit elevated PE ratios at 40.1 and 38.2, respectively. Kotak Small-cap has the lowest PE ratio among the mentioned funds at 36.8 but is still above the benchmark, implying a relative overvaluation.
| Mid-cap funds | Portfolio PE | Benchmark PE | Small-cap funds | Portfolio PE | Benchmark PE |
| Bandhan Midcap fund | 56.2 | 28.9 | Canara Robeco smallcap | 47.9 | 28.9 |
| Motilal Oswal Midcap Fund | 51.1 | 27 | Nippon India smallcap | 41.9 | 28.9 |
| PGIM India Midcap Opportunities fund | 45.5 | 27 | PGIM India smallcap | 40.1 | 28.9 |
| Baroda BNP Paribas Midcap | 45.5 | 27 | Barida BNP Pairbas smallcap | 38.2 | 28.9 |
| Canara Robeco Midcap | 41.8 | 28.9 | Kotak smallcap | 36.8 | 28.9 |
Elevate your savings strategy with our easy-to-use Angel One SIP Calculator. See the impact of consistent investing. Your future self will thank you. Start planning today!
Disclaimer: This blog has been written exclusively for educational purposes. The securities mentioned are only examples and not recommendations. The information is based on various secondary sources on the internet and is subject to change. Please consult with a financial expert before making investment decisions.
Published on: Mar 26, 2024, 4:34 PM IST
We're Live on WhatsApp! Join our channel for market insights & updates
