Today, the major indices, NSE Nifty50 and BSE Sensex, ended the day in the red. The Nifty50 index opened the day at 22,620.40, 50 points higher than the previous day’s closing level of 22,570. During the intraday session, it reached an intraday high of 22,620.40 and a low of 22,385.55, ultimately concluding the day at 22,419.95. This represented a decrease of 150.40 points from the previous day’s closing level.
First things first, the opening and highs of today’s daily candle are exactly the same, indicating significant bearishness in the market. Additionally, it has almost erased 90% of yesterday’s gains.
In the first instance, the Nifty50 formed lower highs and lower lows during the intraday, particularly in the five-minute time frame. In the first five minutes of trading, it formed a red candle. However, after consolidating for 40 to 45 minutes, it eventually broke the consolidation and moved downward, continuing this downward trend until the market closed, as showcased in the image below. The range for today’s trading session is 234.85 points.

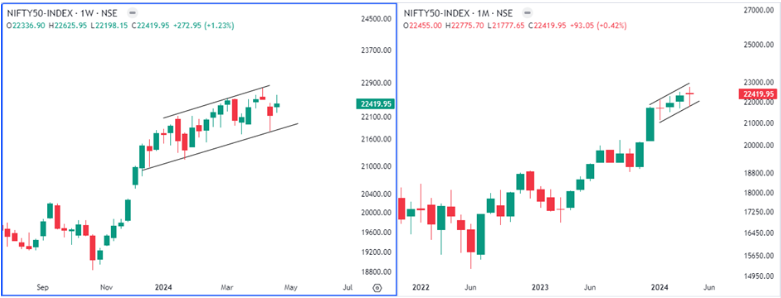
Shifting our focus to the weekly observations, the Nifty has formed a green doji-like candle with a long wick on the upper side compared to the downside wick. Moreover, the Nifty50 crossed last week’s highs but could not sustain the momentum and finally ended the week at around the same level as last week’s high point. The trading range for this week is 428 points.
Looking at the monthly candle has formed a red doji candle with wicks on both sides and a very minimal body size. However, there are still two trading sessions left to conclude this April month. Let’s hope for the best.

The Relative Strength Index (RSI) stands at 53.24 on the daily timeframe, 64.97 on the weekly, and 74.42 on the monthly. Additionally, the Nifty50 has closed above the 20-period moving average on the daily, weekly, and monthly timeframes.
Considering the current weekly expiry set for May 2, 2024, the Call Open Interest in contract terms is approximately 36.33 lakhs, while the Put Open Interest in contract terms stands at 27.48 lakhs. Significant open interest is observed at the 22,500 and 22,600 strike prices on the call side. On the other hand, substantial open interest is noted at the 22,500 and 22,400 strike prices on the put side, suggesting that these levels may serve as immediate resistance and support for the upcoming expiry.
The Put Call Ratio (PCR) currently stands at 0.76, according to data from the National Stock Exchange.
As shown in the images, the candle for the weekly and monthly candles suggests indecision in the market so far. Looking at the intraday day charts, Nifty closed the day at support levels around the Last day’s breakout levels (as shown in the first image above). If it crosses today’s high point, it can be an interesting area. On the downside, there are multiple support levels, as shown in the image below. However, there is a chance the market could open a gap on the down side on Monday, as it broke the two-day consolidation (Tuesday & Wednesday) yesterday. Instead of moving towards the upside after the breakout, it returned to the low point support of the range, signalling that buyers were not as strong, and Thursday’s rally could be due to monthly contract expiry short covering. If on Monday it breaks towards the downside, it can test 22,200 levels.

Disclaimer: This blog has been written exclusively for educational purposes. The securities mentioned are only examples and not recommendations. It is based on several secondary sources on the internet and is subject to changes. Please consult an expert before making related decisions.
Published on: Apr 26, 2024, 5:51 PM IST
We're Live on WhatsApp! Join our channel for market insights & updates
