
This is a chart pattern which can occur after a sharp fall in the stock. A recovery rally seen in the stock price looks like a revival of the uptrend but actually, it is a bull trap.
A “Dead Cat Bounce” (DCB) is a situation in the stock market where a stock or market experiences a short-lived and temporary upward price movement after a significant and sudden drop in its value. This drop usually happens because of some major negative news or event, like a bad earnings report or economic crisis. The initial sharp decline is often referred to as an “event decline.”
The key characteristics of a Dead Cat Bounce include:
It’s called a “Dead Cat Bounce” because, just like a dead cat dropped from a height will bounce a little before falling back down, the stock’s price bounces temporarily before potentially continuing its longer-term downward trend. In essence, a Dead Cat Bounce is a temporary recovery within a more extended downtrend and is often seen as a false signal of a lasting price improvement. Investors and traders need to be cautious when dealing with such rallies, as they may not signify a genuine reversal in the stock’s fortunes.
In technical analysis, the key to identifying patterns like the dead cat bounce lies in studying historical data. While stocks and companies change, the underlying patterns tend to remain consistent. Each market moment may have some variations, but through due diligence, one can start recognizing these patterns after observing them repeatedly. Once you grasp how a pattern functions, you’ll be better equipped to make informed trading decisions based on that understanding.
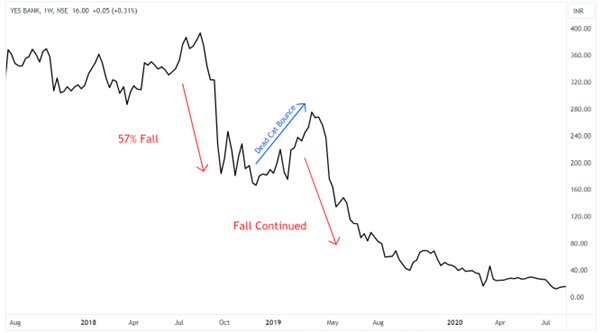
The chart of Yes Bank appears to display the Dead Cat Bounce pattern. Following the initial event, the stock price dropped by approximately 57%. Subsequently, a rally occurred at the beginning of the year, raising hopes among investors that the stock would recover from this level. However, it turned out to be nothing more than a dead cat bounce. In April, the downward trend resumed, causing the price to plummet into the deep red.
Disclaimer: This blog has been written exclusively for educational purposes. The securities mentioned are only examples and not recommendations. It is based on several secondary sources on the internet and is subject to changes. Please consult an expert before making related decisions.
Published on: Oct 31, 2023, 6:19 PM IST
We're Live on WhatsApp! Join our channel for market insights & updates

Get the link to download the App

