
The Indian automobile industry has historically been a good indicator of how well the economy is doing, as the automobile sector plays a key role in both macroeconomic expansion and technological advancement. The two-wheelers segment dominates the market in terms of volume, owing to a growing middle class and a huge percentage of India’s population being young. Moreover, the growing interest of companies in exploring the rural markets further aided the growth of the sector. The rising logistics and passenger transportation industries are driving up demand for commercial vehicles. Future market growth is anticipated to be fueled by new trends including the electrification of vehicles, particularly two-wheelers.
| Share in India’s GDP | 7.1% |
| Employment Generated | 37 million |
| Share in India’s Export | 4.7% |
| Particulars | Year 2023 | Year 2022 |
| Total Sales (units) | 16,999,920 | 15,862,087 |
This growth demonstrates a rebound in the two-wheeler market, reflecting a recovering economy and an increasing consumer demand for personal mobility solutions. The projections for 2024 indicate a further increase to 17,843,445 units, hinting at a continued upward trend. This positive momentum is likely driven by a combination of factors, including urbanization, the need for affordable transportation, and a growing young population.
From 2024 to 2030, the Indian two-wheeler market is projected to witness consistent growth, with sales hitting 22,764,730 units by 2030.
| Market Size in 2024 | 299.2 billion USD (Value terms) |
| Market Size in 2030 ( Estimated) | 335.1 billion USD (Value terms) |
| CAGR ( 2017-2023) | 2.42% |
| CAGR ( 2024-2030) | 1.91% |
Source: https://www.mordorintelligence.com/industry-reports/india-two-wheeler-market
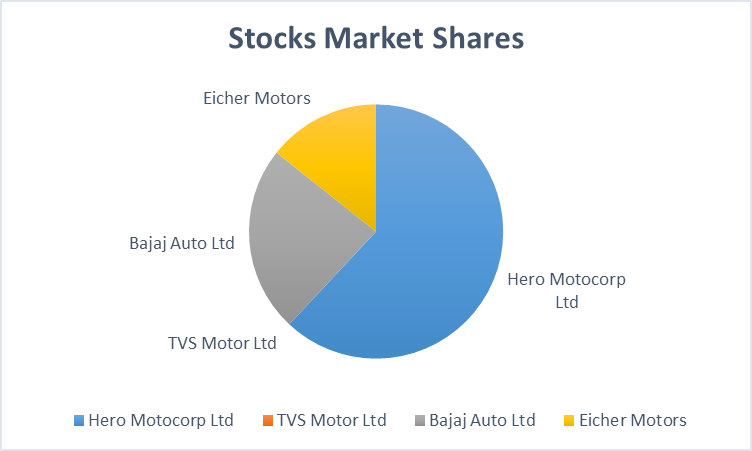
The India Two-Wheeler Market is fairly consolidated, with the top five companies occupying over 92%.
Following the list of top 5 market leaders
1) Monthly Two-wheelers Total Sale Volumes from Jan to May 2024
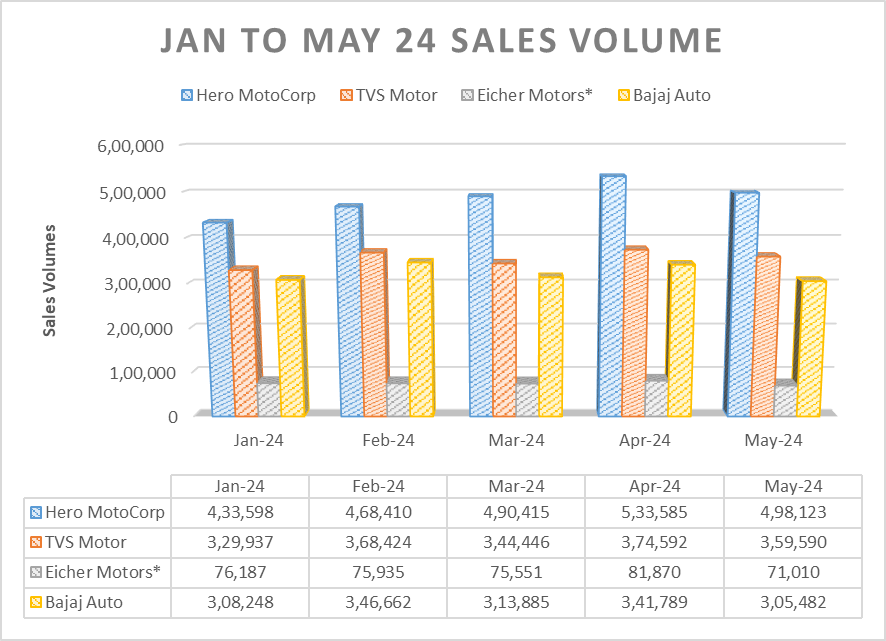
* Eicher motors only Two-wheeler unit ( Royal Enfield) sales figures are considered.
2) Key Figures at a Glance
| Peer Name | PE Ratio | Promoter Holding(%) | YoY Sales Volume(%) | ROCE(%) | ROE(%) | Price to Book Value |
| Hero MotoCorp | 28.36 | 34.76 | 14.02 | 21 | 16.87 | 6 |
| TVS Motor | 62.29 | 50.27 | 25.04 | 21.3 | 24.14 | 15.49 |
| Eicher Motors | 30.87 | 49.15 | 11.87 | 22 | 19.44 | 6.84 |
| Bajaj Auto | 33.56 | 55.06 | 29.41 | 24.62 | 20.64 | 8.93 |
3) Shareholding Pledged and Change in Promoters and Mutual Funds Holdings
| Shareholdings | Hero MotoCorp | TVS Motor | Eicher Motors | Bajaj Auto |
| Share Pledged by Promoters | 0 | 0 | 0 | 0.01 % |
| Change in Promoter Holding (3 Yrs) | 0 | -7.13 % | -0.08 % | 1.36 % |
| Change in Mutual Fund Holding (3 Yrs) | 9.37 % | 5.13 % | 0.72 % | 1.61 % |
4) 5 Years Average of Key Operational Metrics
| Operational Metrics | Hero MotoCorp | TVS Motor | Eicher Motors | Bajaj Auto | Remarks |
| 5yr Avg Cash Conversion Cycle | -26.94 Days | -51.36 Days | -41.27 Days | -24.07 Days | Lower the better |
| 5yr Average Interest Coverage Ratio | 83.71 | 2.22 | 188.35 | 1138.91 | Higher the better |
| 5yr Avg Operating Profit Margin | 14.68 % | 11.91 % | 28.57 % | 21.33 % | Higher the better |
| 5 yr average Debt to Equity | 0.02 | 3.38 | 0.01 | 0 | Higher the better |
| 5yr CAGR Net Profit | -3.99 % | 13.52 % | 5.76 % | 4.22 % | Higher the better |
| 5yr Average Return on Assets | 13.6 % | 3.36 % | 13.77 % | 17.2 % | Higher the better |
Definitions –
5) Company wise Market Shares
Overview: Hero MotoCorp, formerly known as Hero Honda, is the largest two-wheeler manufacturer in the world in terms of unit volume sales in a calendar year. It is based in New Delhi, India.
History:
Key Products:
Market Position: Hero MotoCorp dominates the Indian market, particularly in the commuter motorcycle segment, known for its fuel-efficient and reliable products.
| Balance Sheet | Mar-23 | Mar-24 |
| Assets | 24,202 | 25,572 |
| Non-Current Assets | 14,760 | 15,776 |
| Net Block | 5,761 | 5,462 |
| Capital Work in Progress | 464 | 121 |
| Intangible Assets Under Development | 335 | 360 |
| Long Term Investments | 7,372 | 8,812 |
| Current Assets | 9,037 | 9,796 |
| Liabilities | 24,202 | 25,572 |
| Profit and Loss | Mar-23 | Mar-24 |
| Sales | 33,806 | 37,456 |
| Expenses | 29,815 | 32,200 |
| Operating Profit | 3,991 | 5,256 |
| OPM % | 12% | 14% |
| Other Income | 560 | 733 |
| Interest | 20 | 18 |
| Depreciation | 657 | 711 |
| Profit before tax | 3,875 | 5,258 |
| Tax % | 25% | 25% |
| Net Profit | 2,911 | 3,968 |
| Cashflow | Mar-23 | Mar-24 |
| Cash from Operating Activity | 2,579 | 4,907 |
| Profit Before Tax | 3,875 | 3,968 |
| Adjustments | 137 | 1,178 |
| OCF Before Working Capital | 4,012 | 5,146 |
| Working Capital Changes | -583 | 1,075 |
| Taxes Paid | -850 | -1,314 |
| Cash from Investing Activity | -469 | -1,802 |
| Cash from Financing Activity | -2,041 | -2,733 |
| Net Cash Flow | 70 | 372 |
| Opening Cash & Cash Equivalents | 98.68 | 168 |
| Effect of FX | — | — |
| Closing Cash & Cash Equivalents | 168 | 540 |
| Net Capex (est) | 568 | 710 |
| Free Cash Flow (est) | 2,012 | 4,196 |
| Ratios | Mar-23 | Mar-24 |
| Profitability Ratios | ||
| PBDIT Margin (%) | 13.46 | 16.41 |
| PBIT Margin (%) | 11.52 | 14.51 |
| PBT Margin (%) | 11.46 | 14.03 |
| Net Profit Margin (%) | 8.6 | 10.59 |
| Return on Networth / Equity (%) | 17.42 | 22.06 |
| Return on Capital Employed (%) | 22.07 | 28.57 |
| Return on Assets (%) | 12.51 | 15.51 |
| Total Debt/Equity (X) | 0 | 0 |
| Asset Turnover Ratio (%) | 1.5 | 1.53 |
| Liquidity Ratios | ||
| Current Ratio (X) | 1.61 | 1.5 |
| Quick Ratio (X) | 1.35 | 1.28 |
| Inventory Turnover Ratio (X) | 18.79 | 17.21 |
| Dividend Payout Ratio (NP) (%) | 68.65 | 0 |
| Dividend Payout Ratio (CP) (%) | 56.01 | 0 |
| Earnings Retention Ratio (%) | 31.35 | 0 |
| Cash Earnings Retention Ratio (%) | 43.99 | 0 |
| Valuation Ratios | ||
| Enterprise Value (Cr.) | 46,562.29 | 93,687.90 |
| EV/Net Operating Revenue (X) | 1.38 | 2.5 |
| EV/EBITDA (X) | 10.23 | 15.24 |
| MarketCap/Net Operating Revenue (X) | 1.39 | 2.52 |
| Retention Ratios (%) | 31.34 | 0 |
| Price/BV (X) | 2.81 | 5.24 |
| Price/Net Operating Revenue | 1.39 | 2.52 |
| Earnings Yield | 0.06 | 0.04 |
Overview: TVS Motor Company is the third-largest two-wheeler manufacturer in India, based in Chennai, Tamil Nadu. It is part of the larger TVS Group.
History:
Key Products:
Market Position: TVS is known for its innovation and variety, catering to a broad segment of the market from commuter bikes to performance-oriented motorcycles and scooters.
| Balance Sheet | Mar-23 | Mar-24 |
| Assets | 13,992 | 16,062 |
| Non Current Assets | 10,127 | 11,844 |
| Net Block | 3,596 | 3,772 |
| Capital Work in Progress | 628 | 330 |
| Intangible Assets Under Development | 354 | 600 |
| Long Term Investments | 5,492 | 6,828 |
| Current Assets | 3,668 | 4,218 |
| Liabilities | 13,992 | 16,062 |
| Profit and Loss | Mar-23 | Mar-24 |
| Sales | 31,974 | 39,145 |
| Expenses | 27,947 | 33,645 |
| Operating Profit | 4,027 | 5,500 |
| OPM % | 13% | 14% |
| Other Income | 136 | 106 |
| Interest | 1,368 | 1,928 |
| Depreciation | 859 | 975 |
| Profit before tax | 1,936 | 2,703 |
| Tax % | 32% | 34% |
| Net Profit | 1,309 | 1,779 |
| Cashflows | Mar-23 | Mar-24 |
| Cash from Operating Activity | 1,993 | 3,617 |
| Profit Before Tax | 2,003 | 2,781 |
| Adjustments | 680 | 798 |
| OCF Before Working Capital | 2,684 | 3,579 |
| Working Capital Changes | -208 | 654 |
| Taxes Paid | -483 | -616 |
| Cash from Investing Activity | -2,312 | -1,896 |
| Cash from Financing Activity | 225 | -1,470 |
| Net Cash Flow | -94.4 | 251 |
| Opening Cash & Cash Equivalents | 329 | 234 |
| Effect of FX | — | — |
| Closing Cash & Cash Equivalents | 234 | 486 |
| Net Capex (est) | 997 | 1,056 |
| Free Cash Flow (est) | 996 | 2,562 |
| Ratios | Mar-23 | Mar-24 |
| Profitability Ratios | ||
| PBDIT Margin (%) | 10.52 | 11.52 |
| PBIT Margin (%) | 8.12 | 9.32 |
| PBT Margin (%) | 7.59 | 8.75 |
| Net Profit Margin (%) | 5.65 | 6.55 |
| Return on Networth / Equity (%) | 24.65 | 26.94 |
| Return on Capital Employed (%) | 26.85 | 31.32 |
| Return on Assets (%) | 10.65 | 12.96 |
| Total Debt/Equity (X) | 0.37 | 0.2 |
| Asset Turnover Ratio (%) | 2.04 | 2.11 |
| Liquidity Ratios | ||
| Current Ratio (X) | 0.61 | 0.64 |
| Quick Ratio (X) | 0.4 | 0.43 |
| Inventory Turnover Ratio (X) | 16.63 | 17.83 |
| Dividend Payout Ratio (NP) (%) | 15.93 | 0 |
| Dividend Payout Ratio (CP) (%) | 11.19 | 0 |
| Earnings Retention Ratio (%) | 84.07 | 0 |
| Cash Earnings Retention Ratio (%) | 88.81 | 0 |
| Valuation Ratios | ||
| Enterprise Value (Cr.) | 53,189.89 | 1,03,197.87 |
| EV/Net Operating Revenue (X) | 2.02 | 3.25 |
| EV/EBITDA (X) | 19.17 | 28.18 |
| MarketCap/Net Operating Revenue (X) | 1.94 | 3.22 |
| Retention Ratios (%) | 84.06 | 0 |
| Price/BV (X) | 8.46 | 13.22 |
| Price/Net Operating Revenue | 1.94 | 3.22 |
| Earnings Yield | 0.03 | 0.02 |
Overview: Eicher Motors is an Indian multinational automotive company, and its flagship brand in the two-wheeler segment is Royal Enfield. Royal Enfield is one of the oldest motorcycle brands in continuous production.
History:
Key Products:
Market Position: Royal Enfield is known for its classic and retro-styled motorcycles, appealing to both Indian and international customers looking for leisure and lifestyle motorcycles.
| Balance Sheet | Mar-23 | Mar-24 |
| Assets | 16,876 | 20,473 |
| Non Current Assets | 13,072 | 16,598 |
| Net Block | 2,600 | 2,602 |
| Capital Work in Progress | 468 | 210 |
| Intangible Assets Under Development | 394 | 343 |
| Long Term Investments | 10,060 | 10,768 |
| Current Assets | 3,500 | 3,875 |
| Liabilities | 16,876 | 20,473 |
| Profit and Loss | Mar-23 | Mar-24 |
| Sales | 14,442 | 16,536 |
| Expenses | 10,996 | 12,209 |
| Operating Profit | 3,446 | 4,327 |
| OPM % | 24% | 26% |
| Other Income | 908 | 1,524 |
| Interest | 28 | 51 |
| Depreciation | 526 | 598 |
| Profit before tax | 3,800 | 5,202 |
| Tax % | 23% | 23% |
| Net Profit | 2,914 | 4,001 |
| Cashflow | Mar-23 | Mar-24 |
| Cash from Operating Activity | 2,807 | 3,845 |
| Profit Before Tax | 3,508 | 4,970 |
| Adjustments | -5.54 | -515 |
| OCF Before Working Capital | 3,503 | 4,455 |
| Working Capital Changes | 61.71 | 457 |
| Taxes Paid | -757 | -1,067 |
| Cash from Investing Activity | -2,395 | -3,014 |
| Cash from Financing Activity | -441 | -796 |
| Net Cash Flow | -28.9 | 34.6 |
| Opening Cash & Cash Equivalents | 20.64 | -8.26 |
| Effect of FX | — | 18.86 |
| Closing Cash & Cash Equivalents | -8.26 | 45.2 |
| Net Capex (est) | 647 | 805 |
| Free Cash Flow (est) | 2,160 | 3,040 |
| Ratios | Mar-23 | Mar-24 |
| Profitability Ratios | ||
| PBDIT Margin (%) | 28.67 | 34.5 |
| PBIT Margin (%) | 25.03 | 31.03 |
| PBT Margin (%) | 24.94 | 30.91 |
| Net Profit Margin (%) | 18.64 | 23.31 |
| Return on Networth / Equity (%) | 20.35 | 23.89 |
| Return on Capital Employed (%) | 25.46 | 29.15 |
| Return on Assets (%) | 15.54 | 18.31 |
| Total Debt/Equity (X) | 0.01 | 0.01 |
| Asset Turnover Ratio (%) | 0.9 | 0.86 |
| Liquidity Ratios | ||
| Current Ratio (X) | 1.15 | 1.15 |
| Quick Ratio (X) | 0.85 | 0.84 |
| Inventory Turnover Ratio (X) | 8.64 | 8.76 |
| Dividend Payout Ratio (NP) (%) | 21.89 | 0 |
| Dividend Payout Ratio (CP) (%) | 18.31 | 0 |
| Earnings Retention Ratio (%) | 78.11 | 0 |
| Cash Earnings Retention Ratio (%) | 81.69 | 0 |
| Valuation Ratios | ||
| Enterprise Value (Cr.) | 79,989.51 | 1,10,131.70 |
| EV/Net Operating Revenue (X) | 5.69 | 6.85 |
| EV/EBITDA (X) | 19.83 | 19.85 |
| MarketCap/Net Operating Revenue (X) | 5.74 | 6.84 |
| Retention Ratios (%) | 78.1 | 0 |
| Price/BV (X) | 6.26 | 7.01 |
| Price/Net Operating Revenue | 5.74 | 6.84 |
| Earnings Yield | 0.03 | 0.03 |
Overview: Bajaj Auto is a major Indian two-wheeler and three-wheeler manufacturing company headquartered in Pune, Maharashtra. It is the world’s third-largest manufacturer of motorcycles and the second-largest in India.
History:
Key Products:
Market Position: Bajaj is known for its performance-oriented motorcycles and has a significant presence in the international market, particularly in Africa and Latin America.
| Balance Sheet | Mar-23 | Mar-24 |
| Assets | 31,128 | 34,251 |
| Non Current Assets | 21,912 | 23,893 |
| Net Block | 2,666 | 3,150 |
| Capital Work in Progress | 81.92 | 24.29 |
| Intangible Assets Under Development | — | 3.2 |
| Long Term Investments | 18,504 | 17,525 |
| Current Assets | 8,870 | 10,357 |
| Liabilities | 31,128 | 34,251 |
| Profit and Loss | Mar-23 | Mar-24 |
| Sales | 36,455 | 44,870 |
| Expenses | 29,991 | 36,109 |
| Operating Profit | 6,465 | 8,762 |
| OPM % | 18% | 20% |
| Other Income | 1,703 | 1,704 |
| Interest | 40 | 60 |
| Depreciation | 286 | 365 |
| Profit before tax | 7,842 | 10,040 |
| Tax % | 23% | 23% |
| Net Profit | 6,060 | 7,708 |
| Cashflows | Mar-23 | Mar-24 |
| Cash from Operating Activity | 5,512 | 7,478 |
| Profit Before Tax | 7,409 | 9,822 |
| Adjustments | -701 | -978 |
| OCF Before Working Capital | 6,707 | 8,844 |
| Working Capital Changes | 723 | 1,017 |
| Taxes Paid | -1,918 | -2,383 |
| Cash from Investing Activity | 1,334 | -139 |
| Cash from Financing Activity | -7,179 | -7,110 |
| Net Cash Flow | -333 | 229 |
| Opening Cash & Cash Equivalents | 564 | 219 |
| Effect of FX | -11.39 | 0.19 |
| Closing Cash & Cash Equivalents | 219 | 449 |
| Net Capex (est) | 806 | 796 |
| Free Cash Flow (est) | 4,705 | 6,683 |
| Ratios | Mar-23 | Mar-24 |
| Profitability Ratios | ||
| PBDIT Margin (%) | 21.22 | 22.88 |
| PBIT Margin (%) | 20.44 | 22.1 |
| PBT Margin (%) | 20.33 | 21.98 |
| Net Profit Margin (%) | 15.44 | 16.73 |
| Return on Networth / Equity (%) | 22.13 | 30.08 |
| Return on Capital Employed (%) | 28.72 | 38.68 |
| Return on Assets (%) | 18.07 | 21.83 |
| Total Debt/Equity (X) | 0 | 0.03 |
| Asset Turnover Ratio (%) | 1.16 | 1.37 |
| Liquidity Ratios | ||
| Current Ratio (X) | 1.71 | 1.19 |
| Quick Ratio (X) | 1.44 | 0.99 |
| Inventory Turnover Ratio (X) | 18.27 | 18.92 |
| Dividend Payout Ratio (NP) (%) | 71.98 | 0 |
| Dividend Payout Ratio (CP) (%) | 68.54 | 0 |
| Earnings Retention Ratio (%) | 28.02 | 0 |
| Cash Earnings Retention Ratio (%) | 31.46 | 0 |
| Valuation Ratios | ||
| Enterprise Value (Cr.) | 1,09,611.67 | 2,55,604.75 |
| EV/Net Operating Revenue (X) | 3.01 | 5.72 |
| EV/EBITDA (X) | 14.18 | 25 |
| MarketCap/Net Operating Revenue (X) | 3.02 | 5.71 |
| Retention Ratios (%) | 28.01 | 0 |
| Price/BV (X) | 4.32 | 10.27 |
| Price/Net Operating Revenue | 3.02 | 5.71 |
| Earnings Yield | 0.05 | 0.03 |
Road Ahead…!
The transition to alternative fuels in the Indian two-wheeler market is driven by government incentives, rising fuel prices, and increasing environmental awareness. These companies are expected to expand their electric vehicle portfolios, invest in new technologies, and enhance their production capabilities. The future will likely see a mix of electric, hybrid, and alternative fuel (like ethanol and hydrogen) two-wheelers becoming mainstream, supported by improved charging infrastructure and technological advancements.
The companies that can innovate and adapt quickly will be at the forefront of this transformative shift, tapping into the growing demand for sustainable and efficient transportation solutions.
Hero Motocorp has introduced its electric scooter, the Hero Electric, and is heavily investing in EV technology and infrastructure.
TVS Motor has been proactive in the alternative fuel transition, with the launch of the iQube Electric scooter.
Eicher ( Royal Enfield ) is gradually stepping into the EV market, focusing on research and development to create electric versions of its iconic motorcycles.
Bajaj Auto has launched the electric scooter, Chetak, which has received a positive market response. Bajaj’s partnership with KTM and their investments in electric vehicle (EV) technology signal a strong commitment to this transition.
Also, India’s biggest automobile IPO of 2024! Hyundai’s IPO will open from October 15 to 17, 2024. Don’t miss your chance to be part of the automobile industry!
Disclaimer: This blog has been written exclusively for educational purposes. The securities mentioned are only examples and not recommendations. It is based on several secondary sources on the internet, and is subject to changes. Please consult an expert before making related decisions.
Published on: Jun 13, 2024, 10:42 AM IST
We're Live on WhatsApp! Join our channel for market insights & updates

Get the link to download the App

