The technical analysis universe comprises a variety of chart patterns that offer valuable information regarding potential price movements. These price patterns enable traders to make a decision regarding the sale or purchase of a stock. One of the simplest and most recognisable patterns includes the pin bar candlestick pattern. These patterns are easily recognisable and majorly reliable for pattern trading. A pin bar candlestick helps identify the change in price direction (potential reversals or continuation). Let us understand how to identify a pin bar candlestick, its types, and other information. Also Read More About What is Candlestick Chart Pattern?
Also Read More About What candlestick chart pattern is?
Key Takeaways
-
A Pin Bar candlestick is a simple yet powerful pattern that signals potential price reversals by showing clear rejection from a particular price level.
-
It is identified by its small body and a long wick on one side, which highlights the struggle between buyers and sellers during that period.
-
Pin Bars become more reliable when they form near major support or resistance zones and are confirmed by trend direction or supporting indicators.
-
While the pattern is widely used for reversal trading, it should not be relied on alone, as volatile or sideways markets can create misleading signals.
Identifying a Pin Bar Candlestick Pattern
The pin bar candle stick is one of the most easily recognisable patterns for pattern trading. It indicates the potential reversal of the price trend. It consists of a small body with a long wick (shadow) on one side and a short wick (shadow) on the other. The longer shadow is also called the tail. This tail is generally longer than two-thirds of the whole candlestick and signifies the rejection of price and implies that the price might continue to move in the opposite direction. As this candle stick has a tail that resembles the nose of Pinocchio, it is also called a Pinocchio Bar. The tail (wick) in this bar is longer than the surrounding price action which creates a pin-like appearance.
Main Components of Pin Bar Candlestick Pattern
Understanding the core elements of a Pin Bar helps traders interpret market sentiment more accurately. Each part of this candle reflects how buyers and sellers interacted during that specific period and why the final price movement shifted in a particular direction.
Body
The body of a Pin Bar is usually small and sits near one end of the candle. Its size shows that the opening and closing prices were close together, signalling hesitation or a quick reversal in market direction. A smaller body often means the rejection shown by the wick carries more significance.
Upper Wick
The upper wick becomes prominent in a bearish Pin Bar. It shows that buyers tried to push the price higher but failed to sustain those levels. This rejection at the top often indicates weakening bullish strength and a possible downward reversal.
Lower Wick
The lower wick is the highlight of a bullish Pin Bar. It reveals that sellers pushed the price down sharply, but buyers regained control and forced the price to close higher. This strong rejection from lower levels often points to an upcoming upward move.
Psychology Behind the Pin Bar Candlestick Pattern
A Pin Bar represents a clear shift in market sentiment. The long wick shows strong rejection from one side of the market, while the small body reflects a rapid recovery. Traders interpret this as a warning that the prevailing trend may soon change.
How to Trade Using Pin Bar Candle Patterns?
Traders often use Pin Bars near key support and resistance zones. Once the candle forms, they look for confirmation through volume, trend direction, or a supporting indicator to understand whether the move is likely to be bullish or bearish.
Many enter after the break of the Pin Bar’s high or low, aiming to align with the expected reversal and improve the accuracy of their trade setups.
Types of Pin Bar Patterns
Bullish Pin Bar Pattern
A bullish pin bar pattern is expected to occur at the end of a downtrend or a downward movement. The emergence of this candlestick signifies the potential reversal of the downtrend into a potential bullish trend in the market. The candlestick opens within the price range of the body of the previous candle stick and has a longer downward tail. The upper wick is much shorter and is accompanied by a small body. 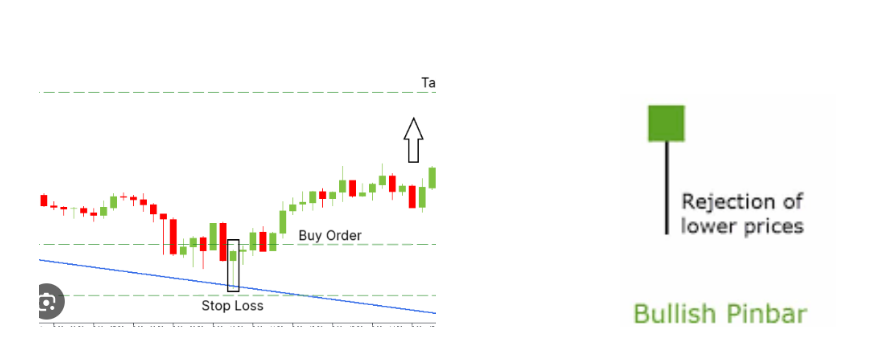 Key considerations to confirm the bullish pin bar:
- To validate the reversal signals, the timeline of the candlestick chart must depict a bearish trend prior to the pin bar candle.
- The previous and subsequent candlestick to the bullish pin bar, should not reach the low price of the pin bar candlestick.
- The subsequent candlestick must be bullish and should open above the pin bar’s closing point.
Bearish Pin Bar Pattern
Contrary to the bullish pin bar, a bearish pin bar can occur at the end of an uptrend or upward movement on the candlestick chart. This pattern, too, consists of a single candle stick with a shorter wick, a short body, and a long tail. However, in the bearish pin bar candlestick consists of a longer upward tail. The tail signifies that the price rose to a high level but was rejected by the market forces and the downward momentum of the price is expected to be continued in the future. Here, the lower wick is much shorter than the tail. 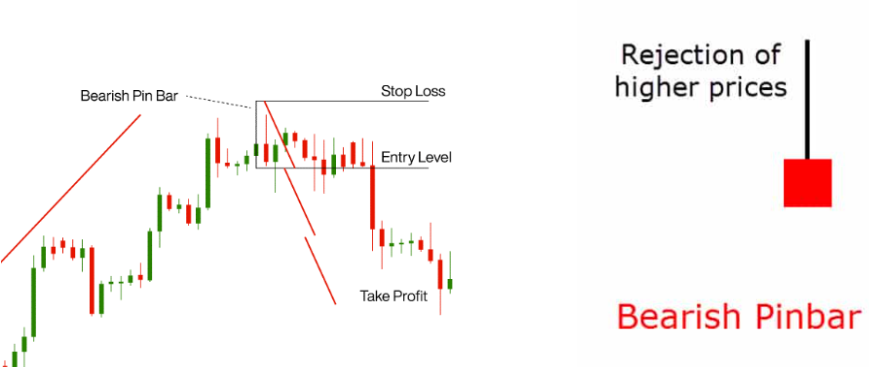 Key considerations to confirm the bullish pin bar:
- To validate the reversal signals, the timeline of the candlestick chart must depict a bullish trend prior to the pin bar candle.
- The previous and subsequent candlestick to the bullish pin bar, should not reach the high price of the pin bar candlestick.
- The subsequent candlestick must be bearish and should open below the pin bar.
Pin Bar Candlestick vs Doji Candlestick
Two of the most recognisable but easy-to-confuse patterns are the pin bar and the doji. Interchanging the pin bar and doji patterns can lead to incorrect trading decisions, potentially costing you your funds. The following table can serve as a guide to recognise the correct pattern when trading so you can make the correct decisions: 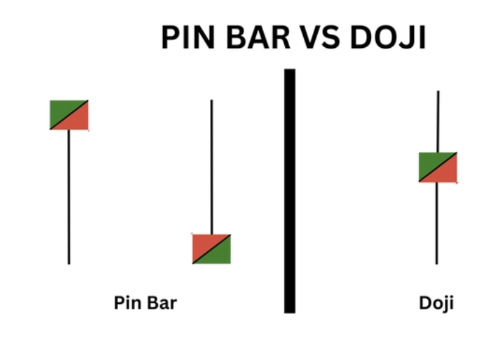
| Feature | Pin Bar | Doji |
| Closing Price | Shifted towards the top/bottom of the candlestick | Near opening price (body in the middle for Long-Legged Doji) |
| Wick Length | Noticeably longer than other candles | Can have wicks on both top and bottom, but not exceptionally long |
| Sentiment | Rejection of price level, suggests trend reversal | Indecision, potential reversal, or consolidation |
| Interpretation | Easier to interpret, indicates a reversal | Requires context for interpretation, suggests a turning point but direction unclear |
Advantages of Using Pin Bar Candlestick Pattern
- Since pin bars provide a clear and recognisable trend reversal signal, they can be considered reliable for trading.
- Pin bars work especially well when they appear near major support or resistance levels, trend lines, or Fibonacci retracement levels. These areas are more likely to signal a trend reversal.
- Pin bars can be seen in any liquid financial market and on any chart time frame, making them popular with day traders, swing traders, and position traders alike.
Limitations of Using Pin Bar Candlestick Pattern
- Pin bars, like any technical indicator, are not free of error. They can give false signals, especially in volatile or erratic market conditions. Therefore, traders should use additional confirmation tools to validate pin bar signals.
- Pin bars cannot predict future market conditions on their own. They indicate potential reversals but do not guarantee the direction or strength of future trends.
- Pin bars are most effective in trending markets, especially near key support or resistance levels. In sideways or range-bound markets, they may produce mixed or unreliable signals.
Conclusion
A pin bar candlestick pattern often helps recognise trend reversals for pattern trading. However, one must exercise caution when making a decision solely based on the pin bar candle stick as they contain their limitations. If you are looking for an online platform to take your trading to the next level, consider Angel One. Why have second thoughts? Open your Demat account with Angel One and level up your trading today!
