In technical analysis, the triangle pattern stands out as a significant continuation pattern, indicating that the prevailing market trend is likely to persist following its formation.
A triangle pattern typically forms through a series of at least five touches on both support and resistance levels. This pattern showcases a tightening range of price movement, reflecting a tug-of-war between bullish and bearish forces in the market.
These patterns illustrate distinct market dynamics: the ascending triangle features a flat upper trendline and a rising lower trendline.
This blog will delve into the specifics of ascending triangles, exploring how traders can effectively identify and trade using this pattern to capitalise on potential price movements.
Read More About Chart Patterns
What Is an Ascending Triangle?
The ascending triangle is a fundamental chart pattern utilised in technical analysis. It forms when price movements allow for a horizontal line along the swing highs and a rising trendline along the swing lows, creating a triangular shape. Traders keenly observe these patterns for breakouts, which can occur upward or downward.
This pattern is categorised as a continuation pattern because the price typically breaks out in the same direction as the preceding trend. Traditionally, traders use ascending triangles to identify clear entry points, establish profit targets, and set stop-loss levels. This pattern contrasts with the descending triangle in its structure and anticipated price movement.
Understanding the Ascending Triangle Pattern
The ascending triangle pattern is widely recognised in technical analysis as a continuation pattern, typically observed within an ongoing uptrend or downtrend. When a breakout from the triangle occurs, traders often react swiftly by either buying aggressively on an upside breakout or selling short on a downside breakout. The breakout's validity is often confirmed by an increase in trading volume, indicating heightened market interest and supporting the breakout direction. Forming an ascending triangle requires at least two swing highs and two swing lows to establish trendlines, with more touches generally enhancing the pattern's reliability. As the price continues to oscillate within the triangle, the coiling effect tends to intensify, potentially leading to a more decisive breakout.
During the triangle formation phase, volume typically contracts, reflecting a period of consolidation. Traders anticipate a breakout with volume expansion as a sign of strength; conversely, breakouts on low volume may indicate a false breakout, suggesting a possible return to the pattern. Trading strategies commonly involve entering positions upon breakout confirmation and placing stop losses just beyond the opposite trendline to manage risk. Profit targets are often calculated by measuring the triangle's height and applying it to the breakout point for upward breakouts or subtracting it for downward breakouts, providing clear objectives for profit-taking.
Example of How to Interpret the Ascending Triangle?
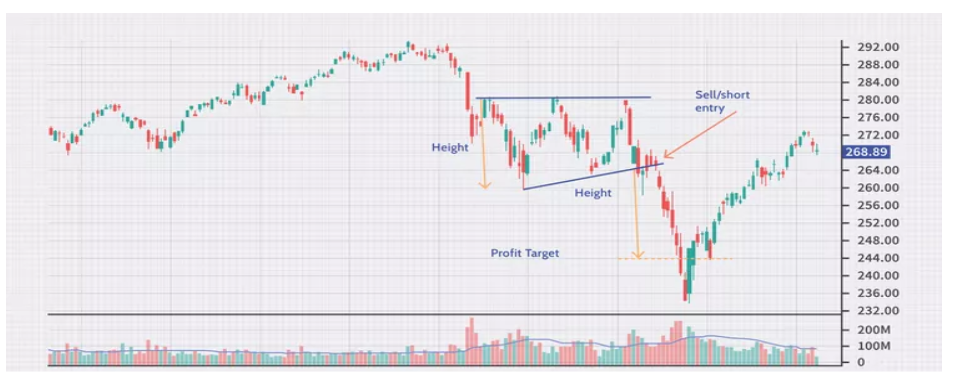
In this instance, a downtrend gives rise to an ascending triangle, and the price stays lower after the breakout. The profit objective was reached after the breakthrough. When the price broke below the lower trendline, it was a short entry or sell signal. One might set a stop loss just above the upper trendline.
Such broad patterns have a higher risk/reward profile than patterns that become much tighter over time. The profit objective is still based on the majority of the pattern, but when a pattern narrows, the stop loss decreases since the distance to the breakout point is reduced.
Support and Resistance in Ascending Triangles
In technical terms, the horizontal upper boundary of the ascending triangle represents a resistance level where upward momentum may stall temporarily due to selling pressure. Conversely, the upward-sloping trendline acts as a support level where buying interest tends to halt downward movements.
Trading Strategy for Ascending Triangles
Traders often enter positions when the price breaks out of the ascending triangle pattern. Buying is favored on an upward breakout above the horizontal resistance, while selling or shorting is considered on a downward breakout below the lower trendline. To manage risk, stop losses are typically placed just outside the opposite side of the pattern. Profit targets are estimated by measuring the height of the triangle at its thickest part and adding or subtracting this amount from the breakout point.
Difference Between an Ascending Triangle and a Descending Triangle
Both ascending triangles and descending triangles hold significance, but they serve to depict contrasting price movements. Ascending triangles are characterised by a horizontal upper trendline, representing a consistent resistance level, and a rising lower trendline, signifying progressively higher lows. This pattern suggests a growing dominance of buyers, persistently pushing prices upward until encountering resistance. Conversely, descending triangles exhibit a horizontal lower trendline, indicating consistent support, and a downward-sloping upper trendline, reflecting progressively lower highs. This formation implies a strengthening presence of sellers, steadily driving prices down until reaching support.
Limitations of Trading Ascending Triangles
1. False Breakouts
Ascending triangles can experience false breakouts, in which the price briefly moves outside the pattern but fails to sustain momentum, leading to a reversal back into the triangle.
2. Pattern Redraw
Traders may need to redraw trendlines or adjust their strategies as the pattern evolves, especially if the price edges past the trendlines without generating significant follow-through.
3. Target Accuracy
While profit targets are estimated based on pattern height, actual price movements may exceed or fall short of these targets, affecting the accuracy of trading decisions.
4. Volume Considerations
Volume tends to contract during the formation of an ascending triangle, and traders look for volume expansion on a breakout to confirm the strength of the move. Low-volume breakouts can indicate weak momentum and potential false signals.
5. Psychological Factors
Patterns like ascending triangles reflect market psychology, where buyers push prices higher until meeting resistance. However, the psychological aspect can lead to unpredictable market reactions despite technical patterns.
Also Know More About Symmetrical Triangle Pattern
Conclusion
By understanding the dynamics of the ascending triangle pattern, traders can gain insights into market behavior and anticipate potential breakout points. The ascending triangle pattern is particularly valuable in technical analysis because it can highlight periods of consolidation followed by potential upward movements. Mastering the ascending triangle pattern equips traders with a valuable tool for navigating the complexities of financial markets. It enables them to identify and act on trading opportunities with greater confidence.
