Understanding the various tools available for technical analysis is essential for traders seeking to make informed decisions. One such tool, the Detrended Price Oscillator (DPO), is particularly valuable due to its unique capability to remove long-term trends and emphasise cyclical patterns within price movements. Unlike other oscillators that focus on current trends, the DPO looks at past price levels, aligning with expected cycle lengths. This retrospective approach helps traders spot peaks and troughs that might not be immediately visible, offering a fresh perspective on market dynamics and enhancing trading strategies. This article will provide a detailed analysis of DPO meaning, including its calculations and indications.
What Is a Detrended Price Oscillator (DPO)?
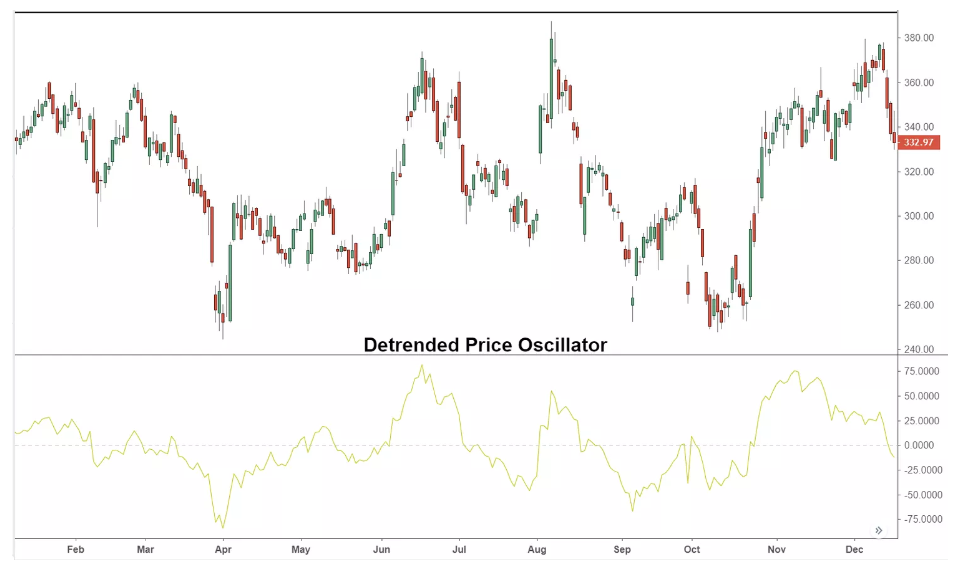
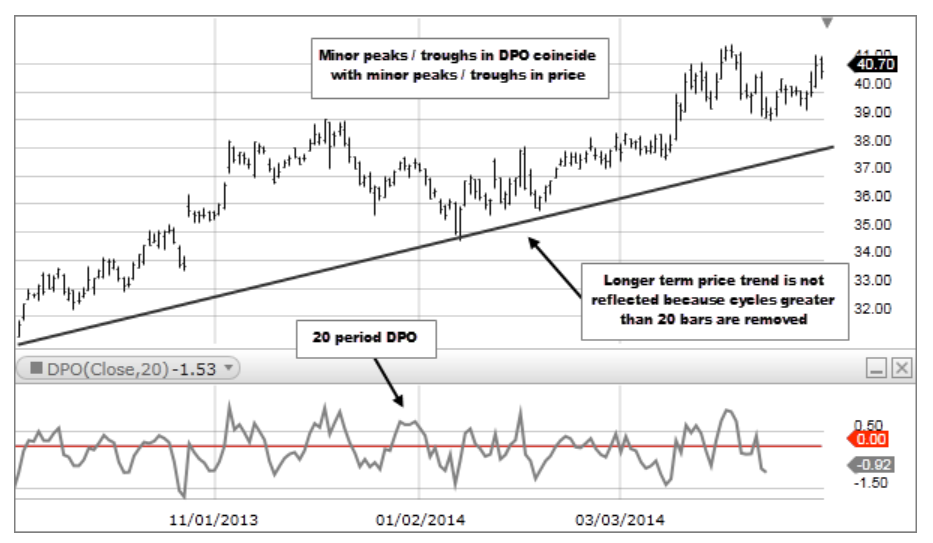
The Detrended Price Oscillator (DPO) is an indicator used to eliminate trends from price data, allowing traders to identify and focus on short-term cycles. Unlike other indicators that align with current prices, the DPO is shifted to the left, looking at past price levels to remove the current trend. As a result, it is not considered a momentum oscillator. Instead, the DPO measures past prices against a Simple Moving Average (SMA) to gauge a cycle's high and low range and its typical duration.
Calculating the Detrended Price Oscillator (DPO)
To calculate the Detrended Price Oscillator (DPO), follow these steps:
- Choose a Lookback Period (X): Determine the number of periods for your lookback. For example, use 20 periods.
- Identify the Past Closing Price: Find the closing price from 𝑋 / 2 +1 periods ago. If using 20 periods, look at the price from 11 periods ago (since 20 / 2+1 = 11)
- Calculate the Simple Moving Average (SMA): Compute the SMA for the last 𝑋 periods. For example, if using a 20-period lookback, calculate the 20-period SMA.
- Determine the DPO Value: Subtract the SMA value from the closing price identified in Step 2. The formula is: DPO=Price from X / 2 +1 periods ago − X period SMA
How to Interpret DPO Signals?
Interpreting Detrended Price Oscillator (DPO) signals involves understanding its purpose and behavior. The DPO is designed to strip away long-term trends from price data, helping to identify cycles and overbought or oversold conditions in a market. By comparing past prices to a shifted moving average, the DPO centers around zero and highlights periodic deviations. Here’s how traders can interpret DPO signals:
1. Zero Line Crossovers
A possible bullish shift is indicated when the DPO crosses above the zero line, implying that the price is above its displaced moving average. Conversely, a cross below zero indicates the price is below the average, signalling bearish momentum. For instance, if a stock's DPO crosses above zero and the price forms a bullish pattern, this could strengthen the case for a long position.
2. Overbought/Oversold Conditions
The DPO can highlight overbought or oversold conditions. An extremely high DPO reading suggests the price is significantly above the mean, potentially indicating a sell signal. Conversely, an extremely low DPO reading indicates the price is significantly below the mean, potentially presenting a buying opportunity. For example, if a currency pair’s DPO is at a multi-month high or low, traders might anticipate a reversal.
3. Divergences
Price action and DPO divergences may indicate impending trend reversals. When the price produces a lower low, and the DPO develops a higher low, suggesting a decreasing downward momentum, this is known as a positive divergence. When the price reaches a higher high, but the DPO creates a lower high, signalling waning upward momentum, this is known as a bearish divergence. A price decline may be predicted, for instance, if the price of oil jumps but the DPO doesn't rise to a matching high.
4. Confirmation with Other Indicators
To validate its indications, the DPO should be utilised in conjunction with other indicators like the Moving Average Convergence Divergence (MACD) or Relative Strength Index (RSI). For instance, a trader might wait for the DPO to cross above zero and the MACD to cross its signal line before initiating a long position.
5. Cycle Length Considerations
The cycle length targeted by the DPO affects its signals. Shorter cycles produce more sensitive oscillations, suitable for short-term trading, while longer cycles smooth out the DPO, making it more useful for identifying longer-term trends.
Example of How to Use the Detrended Price Oscillator
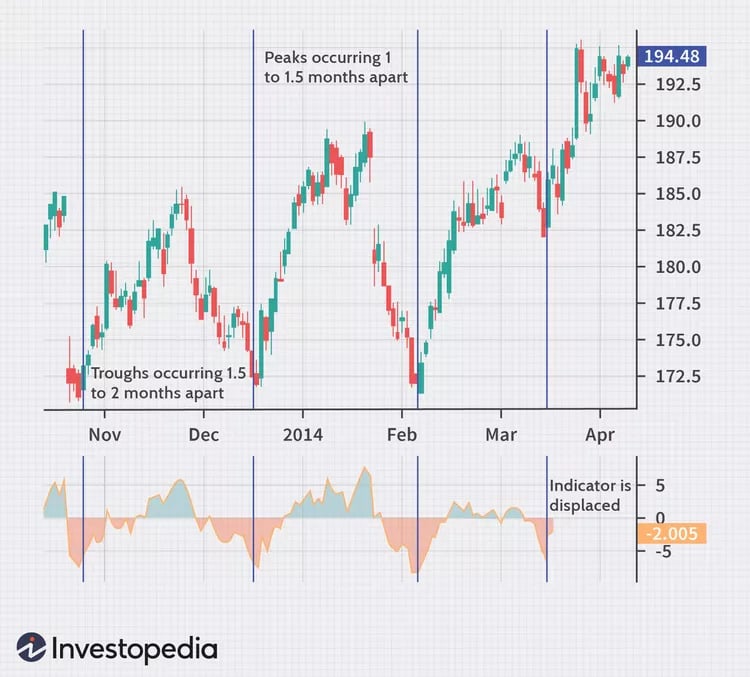
Consider the example of International Business Machines (IBM). In this case, IBM's stock price tends to bottom approximately every 1.5 to 2 months. By recognising this cycle, traders can look for buy signals that align with these timeframes. Conversely, price peaks tend to occur every 1 to 1.5 months. Therefore, traders can look for sell or shorting signals that correspond with these cycles.
By using the DPO to identify these cyclical patterns, traders can make more informed decisions about when to enter or exit positions, optimising their trading strategies based on the observed patterns.
Limitations of Using the Detrended Price Oscillator
The Detrended Price Oscillator (DPO) has some limitations that traders should be aware of:
1. No Standalone Trade Signals
The DPO is not designed to provide direct trade signals. Instead, it helps in timing trades by showing past peaks and troughs. While this historical data can offer a reference for future expectations, there is no certainty that the past cycle lengths will repeat. Future cycles could become longer or shorter.
2. Trend Exclusion
The DPO does not consider the overall trend of the asset. Traders need to independently determine the direction of their trades. For instance, if an asset’s price is plummeting, buying at the cycle bottom identified by the DPO might not be wise since the price could continue to drop.
3. Varying Peaks and Troughs:
Not all peaks and troughs on the DPO reach the same level. Therefore, it’s crucial to also look at the actual price movements to identify significant peaks and troughs. Sometimes, the DPO may show only minor changes, but these could still signal important price reversals.
Conclusion
The Detrended Price Oscillator (DPO) is a powerful tool in technical analysis, highlighting cyclical patterns by filtering out long-term trends. When combined with other indicators, it enhances trading strategies by providing insights into market cycles and potential buy or sell opportunities. Understanding how different indicators complement each other is crucial for informed decision-making in trading.
Disclaimer: This article has been written exclusively for educational purposes. It is based on several secondary sources on the internet and is subject to changes. Please consult an expert before making related decisions.
