For anyone exploring technical analysis, a key starting point is understanding historical price trends. Moving Averages (MAs), such as the Simple Moving Average (SMA) and the Exponential Moving Average (EMA), are tools for this because they smooth out price data. However, traditional MAs often have a downside: noticeable delays in reflecting price changes.
Issue with Price Delays in Traditional Moving Averages
To illustrate how traditional moving averages can cause delays, consider a stock's closing prices over 10 days:
- ₹100
- ₹98
- ₹97
- ₹102
- ₹101
- ₹103
- ₹99
- ₹95
- ₹98
- ₹104
These total of prices is ₹997, giving an SMA of ₹99.70 (₹997 divided by 10 days).
If, on the 11th day, the price rises to ₹110, the new 10-day total becomes ₹1,007 (dropping the first ₹100 and adding ₹110), resulting in an SMA of ₹100.70.
Even though the price sharply increases from ₹104 to ₹110, the SMA only modestly moves from ₹99.70 to ₹100.70, showing a lag because traditional MAs treat recent and older prices equally, thus not promptly reflecting current market conditions.
What Is the Hull Moving Average (HMA)?
Developed by Alan Hull in 2005, the Hull Moving Average is a trend-following tool designed to reduce the lag seen in traditional MAs and provide trend signals. The HMA is especially useful for traders as it accurately captures the current price movement and momentum, aiding swift and informed trading decisions.
The HMA offers a clearer view of:
- The direction a stock or security's price is moving
- The magnitude of this movement
With these insights, traders can better determine their trading positions, entry points, and stop-loss levels.
Unlike traditional MAs that assign equal importance to all data points, the HMA places more emphasis on recent prices, making it more responsive to market changes and helping traders react promptly to new trends. This results in a more precise and clear depiction of price trends, enabling traders to make well-informed decisions quickly.
How Does Using HMA Solve Price Delays?
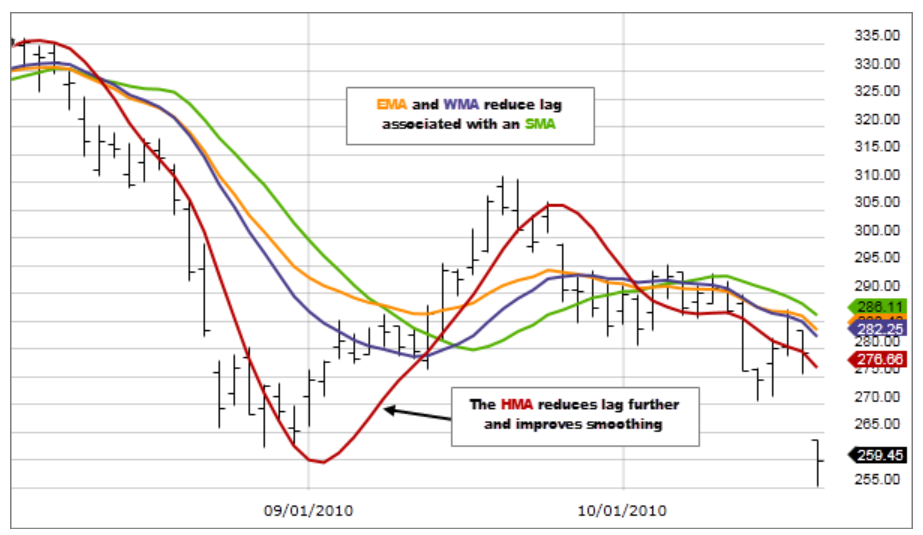
Essentially, the HMA places greater emphasis on recent price shifts, thus decreasing lag and making it more responsive to new price changes. Moreover, this technical tool is computed through a two-step method involving two Weighted Moving Averages (WMAs)—one for a longer duration and another for a shorter span.
The WMA for a longer period helps smooth out fluctuations in price data, providing a clearer trajectory of prices. The shorter-period WMA reduces the indicator's delay, offering a clearer insight into recent price movements.
Understanding the Hull Moving Average Mathematics
The Hull Moving Average (HMA) is built on a foundation of weighted moving averages to react quickly to recent price changes. It utilises a sophisticated formula that includes the square root of the period and combines several weighted averages for a refined and accurate depiction of price trends.
Steps to Calculate Weighted Moving Average (WMA)
Step 1: The WMA prioritises recent prices more heavily. For a given period n, it's calculated as:
WMA(n) = (sum(i=1 to n) (i * Price(i))) / (sum(i=1 to n) i)
where Price(i) is the price at the i-th period.
Step 2: Calculate Half-Period WMA: For half the period n, calculate:
WMA(n/2)
Step 3: Calculate Full-Period WMA: For the entire period n, calculate:
WMA(n)
Step 4: Combine WMAs to Form an Intermediate Value: Create an intermediate value by manipulating the two WMAs:
Intermediate Value = 2 * WMA(n/2) - WMA(n)
Step 5: Final Hull Moving Average Calculation: Apply WMA to this intermediate value over the square root of the period n:
HMA(n) = WMA(sqrt(n)) of the Intermediate Value
For instance, if we calculate the HMA for a period of 9:
- Calculate WMA(4.5) (round to the nearest integer, hence WMA(4)).
- Calculate WMA(9).
- Form the Intermediate Value: Intermediate Value=2×WMA(4)−WMA(9)
- Apply WMA over the square root of 9 (which is 3): HMA(9)=WMA(3) of the Intermediate Value
Although the formula for the HMA might initially seem complex, it is crafted to reflect true market behaviour, giving more importance to recent price data while considering the overall trend. This helps traders spot significant market shifts and reduces the distraction of minor fluctuations.
Additionally, integrating multiple weighted moving averages in the HMA calculation brings a deeper level of detail by highlighting various aspects of price movements. This multifaceted approach boosts its precision, aiding traders in making well-informed decisions.
Setting Up the Hull Moving Average
1. Choosing the Right Time Frame
Before you start using the HMA in your trading, it’s important to pick the right time frame. This choice should align with your trading style and the type of asset you are trading. For example, short-term traders might find shorter time frames like 5-minute or 15-minute charts more useful, whereas long-term traders might opt for daily or weekly charts.
2. Selecting the Appropriate Moving Average Period
Another key step in configuring the HMA is choosing the moving average period, which affects how quickly the indicator reacts to price changes. Short periods such as 9 or 12 are quicker to respond and are good for short-term traders who need timely signals. Longer periods, like 20 or 50, provide a wider view of the market trends and are better for long-term traders.
3. Interpreting the Hull Moving Average Line
Once the HMA is applied to your chart, knowing how to read the indicator line is vital. If the HMA line is rising, it typically indicates a bullish trend. If it’s falling, this suggests a bearish trend. A flat HMA line may indicate a market in consolidation or a time of uncertainty.
Different Strategies for Using HMA
For short-term traders focusing on technical analysis, the Hull Moving Average (HMA) can be more advantageous than traditional moving averages. If you're interested in capitalising on quick market shifts, the HMA can help you identify the current market trend, pinpoint where support and resistance levels are emerging, and spot potential points for entering or exiting trades.
Additionally, there are several specific strategies involving moving averages that you might find useful, described as follows:
1. Trend Following Trades:
Use the HMA to detect the ongoing trend and decide whether to go long or short. An upward-trending HMA indicates a bullish market, suggesting a good time to buy, while a downward trend may signal a bearish market, prompting a short sale.
2. Filter Trading Strategy:
A common challenge in technical analysis is the occurrence of false signals. The HMA can help filter out these inaccuracies by reducing market noise. Setting a threshold slightly above or below the HMA can help differentiate between true market moves and random, misleading fluctuations.
3. Divergence Trading Strategy:
This strategy focuses on discrepancies between the HMA and current price movements. If prices reach new highs or lows but the HMA doesn’t follow, it could indicate that the trend is weakening, potentially signalling an upcoming reversal.
4. HMA Crossover Strategy:
Monitor interactions between a longer and a shorter HMA to find buying or selling opportunities based on their crossover points. If the shorter HMA crosses above the longer one, it suggests increasing prices and a buying opportunity. Conversely, a crossover below may suggest selling.
5. HMA Breakout Strategy:
This strategy leverages early signals from price breakouts. If the price moves beyond an existing support or resistance level, and particularly if it breaks above the HMA, it may indicate a strong upward trend and a buying signal. Conversely, a price dip below the HMA might suggest selling.
HMA: Benefits and Drawbacks
Before incorporating the Hull Moving Average (HMA) into your trading strategies, it's crucial to understand both its advantages and disadvantages. This knowledge will enable you to leverage its strengths and mitigate its weaknesses.
Benefits of the HMA:
- It quickly reacts to recent price changes.
- It significantly smooths out price fluctuations.
- It is versatile and suitable for various time frames, market conditions, and trading objectives.
- It is straightforward to interpret.
- It supports a broad array of trading strategies.
Drawbacks of the HMA:
- It might occasionally produce misleading signals.
- It is sensitive to rapid and short-term price movements.
- It is a complex indicator that may be challenging for beginners to understand.
Conclusion
This guide provides an overview of the Hull Moving Average and its application in trading for better-informed decisions. Remember, relying solely on one indicator is not advisable. Combining multiple indicators will give you a more thorough understanding of market conditions before making trading decisions.
Disclaimer: This article has been written exclusively for educational purposes. It is based on several secondary sources on the internet and is subject to changes. Please consult an expert before making related decisions.
