Time-series analysis comprises a set of techniques and methods used to examine time-series data and derive valuable insights. In contrast, time-series forecasting is a predictive approach that estimates future values based on historical data accumulated over time.
A time series is sequential data recorded at specific intervals. This type of data is extensively collected by financial institutions, governments, and weather forecasting agencies to inform future planning and strategies.
Due to its broad range of applications, numerous techniques and tools have been developed to analyse time series data and predict future values. Let us explore these techniques and examine the use of different indicators while undertaking technical analysis.
What is Time Series Forecast (TSF)?
Time series forecasting involves analysing time series data through statistical and modeling techniques to make predictions and guide strategic decision-making. While these forecasts are not always exact and can vary significantly—especially given the fluctuating nature of time series data and external factors—they provide valuable insights into the likelihood of different outcomes. Generally, the more comprehensive the data, the more accurate the forecasts.
Although forecasting and prediction are often used interchangeably, there is a subtle distinction. In some industries, forecasting refers to predicting data at a specific future point, whereas prediction can refer to future data in a more general sense.
Time series forecasting is frequently used alongside time series analysis. Time series analysis involves creating models to understand the data and the underlying causes of observed outcomes. This analysis explains the "why" behind the results. By projecting future patterns and results based on the examined facts, forecasting expands on this understanding.
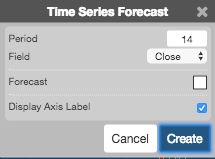
Configuration Options
- Period: The number of bars to include in the calculations.
- Field: The price or combination of prices to use as the base for average calculations. Possible values include:
- Open
- High
- Low
- Close
- Adjusted Close
- HL/2 (High + Low) / 2
- HLC/3 (High + Low + Close) / 3
- HLCC/4 (High + Low + Close + Close) / 4
- OHLC/4 (Open + High + Low + Close) / 4
- Color Selectors: The colors to use for graph elements.
- Display Axis Label: Option to display the most recent value on the Y-axis.
Formula
The best fit line for the n points (x1,y1),(x2,y2),…,(xn,yn)is represented by the equation:
y=mx+b
where m is the slope and b is the y-intercept.
How To Understand the Time Series Forecast Indicator?
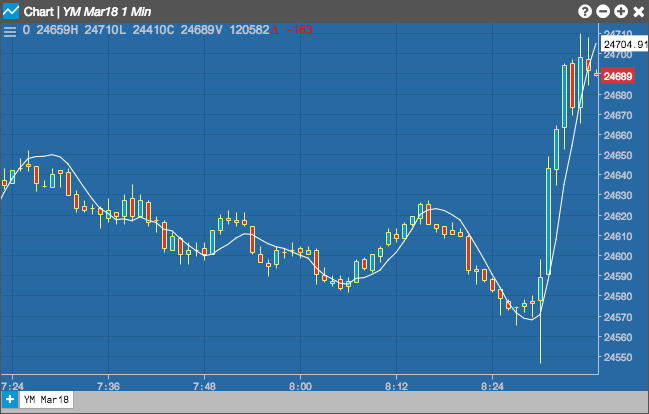
The most common method for interpreting the Time Series Forecast (TSF) indicator is the "momentum" technique. This involves monitoring the direction of the indicator line over time—whether it is rising or falling. An upward movement may suggest increasing buying pressure (indicating a potential price increase), while a downward movement may suggest increasing selling pressure (indicating a potential price decrease).
Additionally, rapid shifts from extreme highs or lows can signal an imminent trend reversal. However, it is essential to exercise caution, as seemingly obvious readings may not always reliably predict future performance. When used and understood correctly, TSF signals can increase price movement forecast accuracy and offer insightful information about market patterns.
Applications of Time Series Analysis in Stock Prediction
- Trend Analysis: Time series analysis identifies long-term trends in stock prices, indicating the overall direction of a stock. Investors can adjust their strategies based on bullish or bearish trends, such as adopting a buy-and-hold approach for upward trending stocks or implementing short-selling strategies for downward trending stocks.
- Seasonal and Cyclical Analysis: Many stocks show recurring patterns due to seasonality or cyclicality in their businesses. Time series analysis uncovers these patterns, allowing investors to capitalise on seasonal trading opportunities or adjust their portfolios accordingly.
- Volatility Forecasting: Volatility measures price fluctuation in a stock or the overall market. Time series analysis forecasts volatility, helping investors manage risk effectively. Models like GARCH or ARCH (Autoregressive Conditional Heteroskedasticity) estimate future volatility levels, aiding in implementing adaptive strategies and adjusting position sizes.
- Trading Strategy Development: Time series analysis forms the basis for developing trading strategies. By analysing historical data, identifying patterns, and creating predictive models, investors can establish systematic trading rules. Technical indicators derived from time series analysis, such as moving averages or RSI, combined with price forecasts, generate buy or sell signals, automating trading decisions.
- Portfolio Optimisation: Time series analysis optimises portfolio management strategies by considering relationships between stocks or asset classes. Identifying correlations or statistical relationships enables the construction of diversified portfolios to maximise returns while minimising risks.
- Event Impact Assessment: Significant events affect stock prices. Time series analysis assesses the potential impact of events by studying historical data. Analysing past reactions to similar events helps investors anticipate and manage the consequences of upcoming events.
Considerations for Time Series Forecasting
- Seasonality: Determine if your data exhibits seasonal patterns. Certain stocks may perform better during specific months or seasons of the year.
- Trend: Identify any underlying trends in your data. A trend indicates a consistent increase or decrease in value over a period.
- Noise: Assess the level of noise in your data. Noise refers to random fluctuations that cannot be attributed to any specific factor.
Technical Analysis of Time Series Forecasting Models
There are several models commonly used for time series forecasting:
- Moving Average Model
- Exponential Smoothing Model
- ARIMA Model (AutoRegressive Integrated Moving Average)
- OHLC or Candlestick Chart
Moving Average Model
The Moving Average Model is a popular tool for time series analysis, especially in the Indian stock market. It calculates the average of a specified number of past data points to identify trends and smooth out fluctuations.
Traders use moving averages to generate buy or sell signals based on crossovers with the stock's current price. The Simple Moving Average (SMA) and Exponential Moving Average (EMA) are the two most widely used forms. Understanding these averages helps investors make informed decisions by highlighting potential shifts in stock price trends.
Formula:
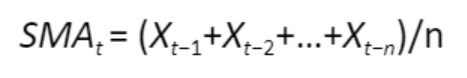
Where:
- SMA(t) is the simple moving average at time (t).
- Xt-1 + Xt-2+....are the data points for the previous (n) periods.
This formula calculates the average of the last (n) data points at each time point (t) in a time series.
Exponential Smoothing Model
The Exponential Smoothing Model is a versatile forecasting technique widely used in the Indian stock market due to its adaptability to changing trends. It assigns exponentially decreasing weights to past observations, giving more importance to recent data. This model is particularly effective for capturing short-term fluctuations and responding quickly to market changes.
The smoothing parameter, alpha (α), controls the influence of recent observations, with higher values placing more emphasis on recent data. By using exponential smoothing, investors may increase the responsiveness of their predictions and improve their ability to manoeuvre in a volatile market.
ARIMA Model
The ARIMA (AutoRegressive Integrated Moving Average) model is a robust tool for time series forecasting, extensively applied in the Indian stock market. ARIMA combines autoregressive (AR), differencing (I), and moving average (MA) components to capture and predict complex patterns in stock prices. Investors use ARIMA to identify trends, seasonal patterns, and cyclic behaviors in historical stock data.
The model requires tuning parameters such as p (autoregressive order), d (differencing order), and q (moving average order) for optimal performance. ARIMA modeling enhances predictive capabilities, aiding investors in making more informed decisions in the ever-changing stock market environment.
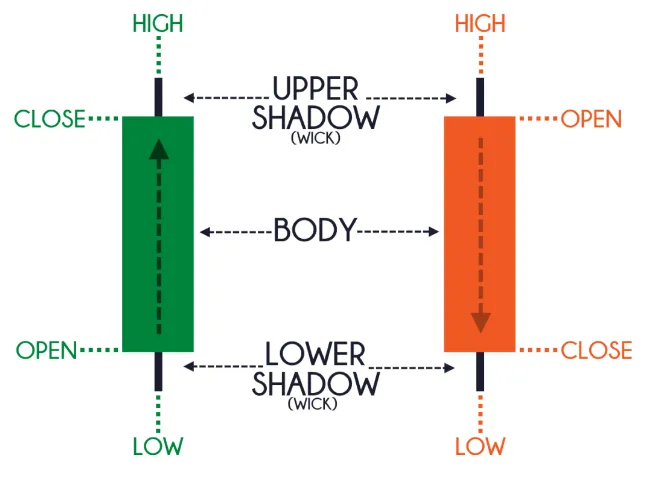
OHLC or Candlestick Chart
An OHLC (open-high-low-close) or candlestick chart is a widely used tool for representing the price trends of a financial instrument over time. Each vertical line on the chart illustrates the price range (highest and lowest prices) for a specific time unit, such as one day or one month.
The upper wick and lower wick of each candlestick indicate the opening or closing prices for that period. The bars can be displayed in different colors to signify whether prices rose or fell during the time frame.
Conclusion
Time series analysis and forecasting are indispensable tools in the realm of stock market analysis. By delving into historical data patterns and employing various techniques such as trend analysis, seasonal and cyclical analysis, volatility forecasting, and trading strategy development, investors can learn important things about market patterns and price movements.
The Time Series Forecast (TSF) indicator, along with other technical analysis tools, provides a systematic approach to understanding market dynamics and making informed investment decisions. As the financial landscape continues to evolve, leveraging time series forecasting techniques will remain essential for navigating the complexities of the stock market.
Disclaimer: This article has been written exclusively for educational purposes. It is based on several secondary sources on the internet and is subject to changes. Please consult an expert before making related decisions.
